Generic selectors
Exact matches only
Search in title
Search in content
Post Type Selectors

Popular stocks

Crypto

CFD

Currencies

Support

Gold

NSDQ – Technical Analysis – 4h

October 28, 2025 08:00

Quick Summary

The NASDAQ 100 Index is showing strong bullish signals. Recent technical indicators suggest continued upward momentum.

With a volume-backed breakout, the asset appears poised for further gains in the short term.

Candlestick Analysis

The chart indicates a strong bullish trend. Recent candles are predominantly green with higher highs and higher lows.

There is a noticeable bullish candlestick formation at the breakout point above the resistance level around 25,200.

A breakout is occurring, suggesting a continuation of the current uptrend.

MACD Analysis

The MACD line is above the Signal line, indicating a bullish crossover and potential sustained upward momentum.

The MACD histogram shows increasing positive bars, suggesting strengthening momentum for the bulls.

No bearish divergence is evident between the MACD and price action, reinforcing the current uptrend.

Volume Analysis

There is an increase in trading volume accompanying the recent price surge, supporting the breakout and ongoing bullish trend.

No unusual spikes suggest institutional activity beyond the noted supportive volume transition.

The volume trend backs the bullish scenario, adding credibility to the upward movement.

Support & Resistance

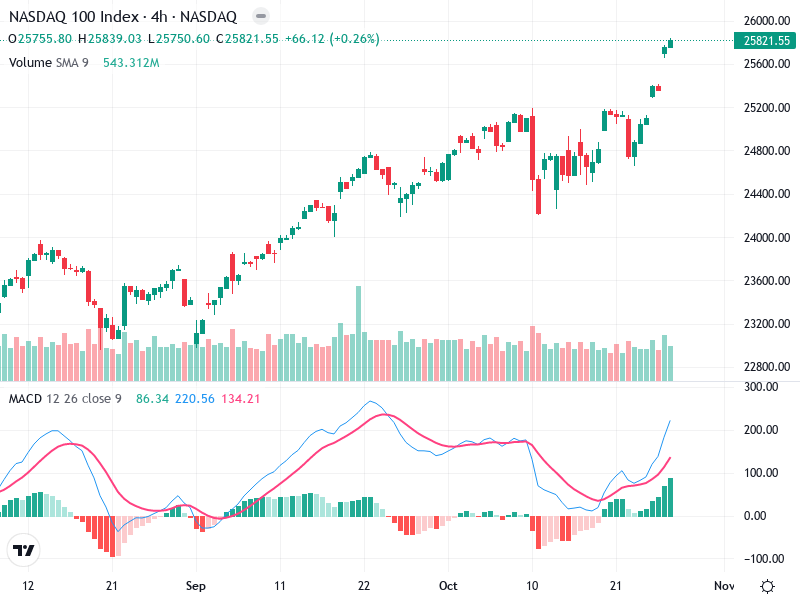
Key support is around 25,200, a previous resistance zone, which could act as a potential pullback zone.

With the breakout, the next psychological resistance level could be closer to 26,000.

The levels provide a roadmap for potential price targets and risk management.

Actionable Insights

Consider buying on minor pullbacks to the new support zone at 25,200, provided volume remains supportive.

Current holders may continue to ride the trend, watching for any signs of trend exhaustion.

Caution should be exercised if the price falls significantly below 25,200 with increased selling volume.

The AI Technical Analysis Center is an informational tool only and does not constitute investment or trading advice.
This site is registered on wpml.org as a development site. Switch to a production site key to remove this banner.