Generic selectors
Exact matches only
Search in title
Search in content
Post Type Selectors

Popular stocks

Crypto

CFD

Currencies

Support

Gold

AUD/USD – Technical Analysis – 4h

October 28, 2025 13:03

Quick Summary

The chart of demonstrates a shift from bearish to a bullish trend indicating an upward momentum supported by technical indicators.

Recent patterns and breakout levels suggest continued interest and buying pressure, focusing on key support levels.

Candlestick Analysis

The chart shows a transition from a bearish trend to a more bullish outlook in recent sessions with higher highs and higher lows indicating bullish momentum.

Noticeable patterns include bullish engulfing patterns earlier in the upward move, suggesting reversal from prior bearish sentiment. There are also smaller bullish candles indicating steady buying pressure.

A recent breakout above the 0.6520 level, which previously acted as resistance, confirming upward momentum.

MACD Analysis

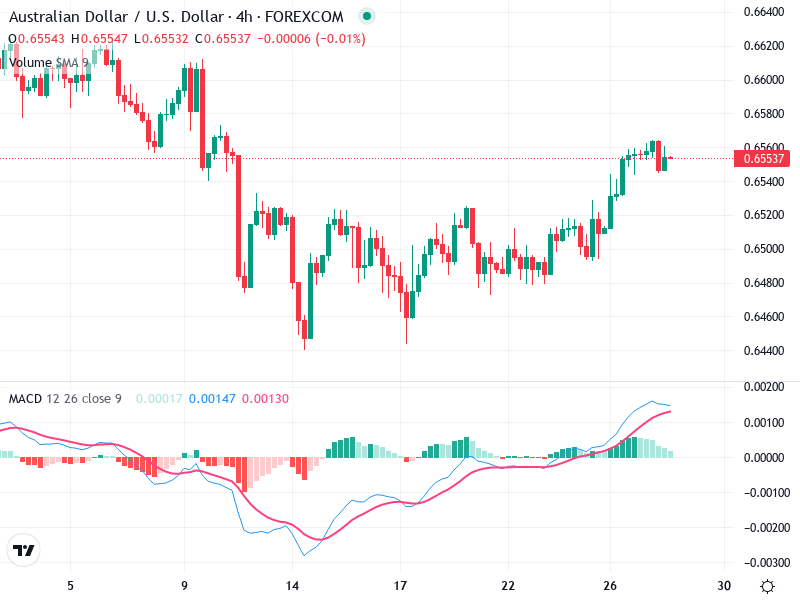
There is a bullish crossover with the MACD line crossing above the signal line, which is often a buy signal, indicating increasing bullish momentum.

The histogram is in positive territory and showing increasing momentum, supporting the bullish trend.

Currently, there are no clear divergences observed between price and MACD, confirming alignment in trend direction.

Volume Analysis

While the chart shows steady volume, it's important to note that volume spikes occurred during breakouts and reversals, indicating strong market interest.

Increased volume supports recent price increases, confirming the legitimacy of the bullish trend.

Support & Resistance

Key support is identified around the 0.6520 level, which was previously resistance.

Immediate resistance appears near the 0.6580 level and could be tested soon given the current upward momentum.

Actionable Insights

Consider buying opportunities on pullbacks close to the support level of 0.6520 if the bullish trend continues. Look for confirmation with bullish candlestick patterns or volume support.

Set potential sell targets close to the resistance level of 0.6580, or wait for signs of bearish divergence in MACD or volume to confirm a reversal.

If currently holding, maintain positions while monitoring support and resistance levels for any signs of reversal.

The AI Technical Analysis Center is an informational tool only and does not constitute investment or trading advice.
This site is registered on wpml.org as a development site. Switch to a production site key to remove this banner.