Generic selectors
Exact matches only
Search in title
Search in content
Post Type Selectors

Popular stocks

Crypto

CFD

Currencies

Support

Gold

GOLD – Technical Analysis – 4h

October 28, 2025 17:03

Quick Summary

This chart provides an in-depth look at ‘s current market trends and potential future movements. Observing the candlestick, MACD, and volume activities reveals critical insights for decision-making. Overall, is showing a broadly bearish sentiment, but potential reversals should be monitored closely.

Candlestick Analysis

The overall trend appears broadly bearish, following a previous bullish rally. Recent candlesticks show a pullback from the downtrend.

A potential reversal pattern is forming with smaller green candlesticks emerging after a sharp decline, which often suggests consolidation or a potential reversal.

Watch the area around 3900 for support; a break below this could signal further downside. Conversely, a move above 4000 might indicate a reversal or continuation of upward momentum.

MACD Analysis

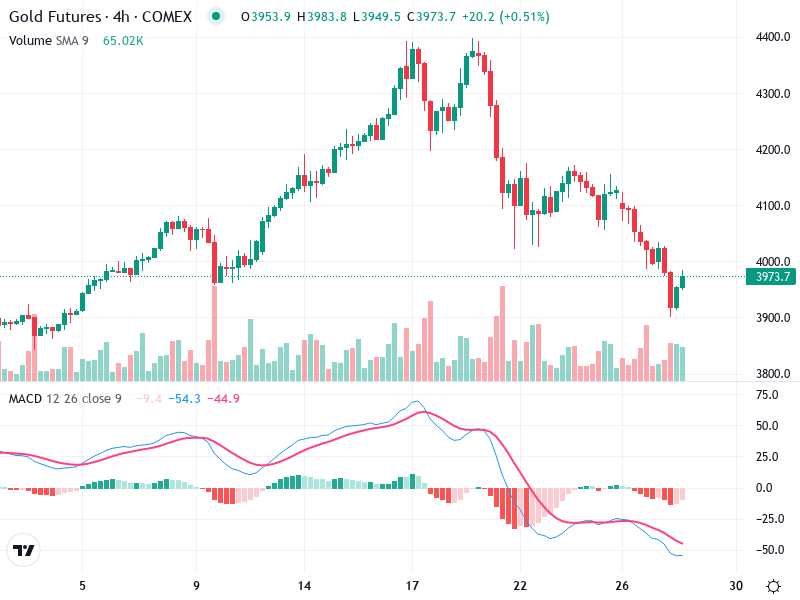
The MACD line is below the Signal line, indicating bearish momentum. However, the gap is narrowing, suggesting a potential bullish crossover.

The histogram is negative but showing signs of a decrease in bearish momentum as the bars become less pronounced, supporting potential bottoming.

No clear divergence, yet the slowing momentum hints at the potential for a reversal.

Volume Analysis

There is an increase in volume on the recent downward move, typically confirming the bearish trend.

The largest volume spikes coincide with large red candlesticks, suggesting heavy selling pressure or institutional activity.

Volume remains supportive of bearish moves but shows increased interest as price hovers near key support.

Support & Resistance

Near 3900 has been tested and shown resilience.

Around 40004100 is immediate resistance, as recent price action has struggled to maintain gains above this level.

Volume remains supportive of bearish moves but shows increased interest as price hovers near key support.

Actionable Insights

Consider buying if the price breaks above 4000 with strong volume, ideally confirmed by a MACD bullish crossover.

Short positions could be effective if price breaks below the 3900 support with a confirming volume surge.

For those already in a position, watch for a decisive move outside the 3900-4000 range for clearer direction.

The AI Technical Analysis Center is an informational tool only and does not constitute investment or trading advice.
This site is registered on wpml.org as a development site. Switch to a production site key to remove this banner.