Generic selectors
Exact matches only
Search in title
Search in content
Post Type Selectors

Popular stocks

Crypto

CFD

Currencies

Support

Gold

GOLD – Technical Analysis – 4h

October 29, 2025 17:02

Quick Summary

The chart reflects a general trend with key support and resistance levels clearly defined.

Recent price movements show signs of momentum shifts, providing valuable insights for potential trading opportunities.

The overall picture suggests cautious optimism amidst volatile movements.

Candlestick Analysis

The chart exhibits a bearish trend with recent bullish recovery attempts.

There is a notable bullish engulfing pattern near the recent lows, suggesting potential reversal or consolidation.

Resistance is visible around 4100, with a potential breakout zone. Support is apparent near 4000, where the price recently bounced.

MACD Analysis

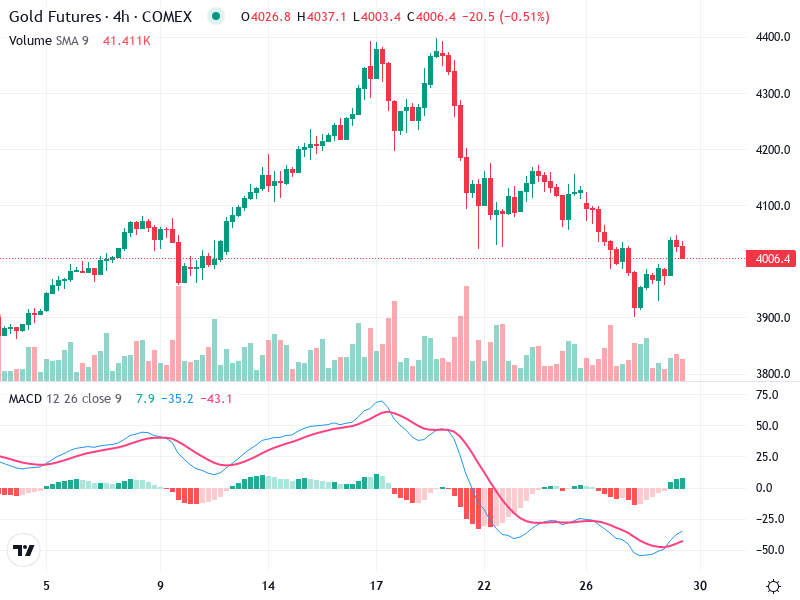
The MACD line recently crossed above the Signal line, indicating a bullish crossover, which might suggest a change in momentum towards a bullish sentiment.

The histogram shows decreasing bearish momentum, supporting the bullish crossover evidence.

There is no apparent divergence at this point, as price patterns and MACD movements are aligning.

Volume Analysis

Increased volume accompanies the recent bullish candles, supporting the recent upward price movement and suggesting stronger buying activity.

The strong volume on recent up-moves may indicate institutional buying.

The increase in volume during the recent price ascent suggests possibly significant market interest.

Support & Resistance

Key support is around the 4000 level where a bounce occurred.

Notable resistance is around 4100, where prior consolidations occurred and may need to be broken for continued upward movement.

Monitoring these levels will be crucial for assessing market direction.

Actionable Insights

Consider buying on signs of further bullish momentum, especially if the price breaks and holds above the 4100 resistance with increased volume.

Watch for price rejection and a return below the support zone at 4000 for potential short opportunities.

If currently long, assess strength near the resistance before determining further actions.

The AI Technical Analysis Center is an informational tool only and does not constitute investment or trading advice.
This site is registered on wpml.org as a development site. Switch to a production site key to remove this banner.