Generic selectors
Exact matches only
Search in title
Search in content
Post Type Selectors

Popular stocks

Crypto

CFD

Currencies

Support

Gold

NSDQ – Technical Analysis – 4h

October 30, 2025 08:00

Quick Summary

The NASDAQ 100 Index presents a robust bullish setup, driven by consistent upward movements in the chart. The index has broken past significant levels, showcasing strong momentum.

Technical indicators such as MACD and volume support the prevailing bullish trend.

Candlestick Analysis

Recently, a bullish continuation pattern is visible as the index continues to form higher highs and higher lows.

The trend is clearly bullish, indicated by the consistent upward movement and formation of green candlesticks.

A breakout above previous highs occurred around the 25,600 mark, and the index is now consolidating above 26,000.

MACD Analysis

The MACD line is well above the Signal line, confirming a bullish crossover that suggests positive momentum.

The MACD histogram is in positive territory and increasing, indicating strengthening bullish momentum.

There appears to be no significant divergence between MACD and price action, supporting the current upward trend.

Volume Analysis

Volume spiked during the breakout above 25,600, providing confirmation of the upward movement.

The current volume remains healthy and supports the bullish trend, although slight reduction hints at possible consolidation.

No unusual volume spikes indicate sustained interest without undue speculation.

Support & Resistance

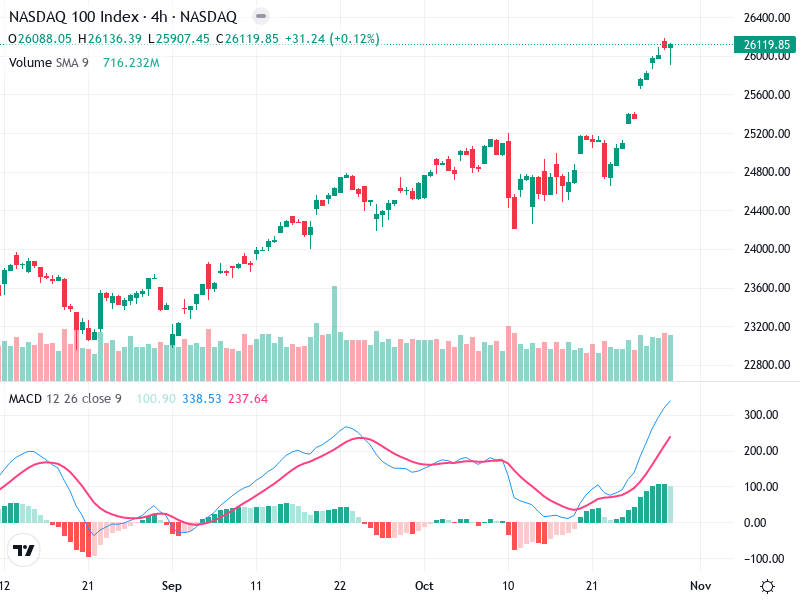
Key support is around 25,600, where the breakout occurred. Secondary support is at 25,200, a previous consolidation zone.

The immediate resistance isn't clearly defined above 26,000, but psychological levels and past highs around this area may pose minor resistance.

Monitoring these levels can provide insight for future price movements.

Actionable Insights

Traders could consider buying on pullbacks near 25,600 or on a confirmed breakout above the current levels with strong volume.

Consider taking profits if the index shows signs of reversal at resistance levels or if MACD starts to show bearish crossover.

Long-term holders may continue to hold as the overall trend remains bullish, watching for any trend reversals.

The AI Technical Analysis Center is an informational tool only and does not constitute investment or trading advice.
This site is registered on wpml.org as a development site. Switch to a production site key to remove this banner.