Generic selectors
Exact matches only
Search in title
Search in content
Post Type Selectors

Popular stocks

Crypto

CFD

Currencies

Support

Gold

GBP/USD – Technical Analysis – 4h

October 30, 2025 13:04

Quick Summary

The chart for indicates a prevailing trend with significant bearish characteristics.

Multiple analysis tools confirm the current market direction.

Candlestick Analysis

The chart displays several red candlesticks, indicating strong bearish momentum.

There is a large red candle, suggesting increased selling pressure.

Price is breaking below recent support levels around 1.31500.

MACD Analysis

The MACD line is below the Signal line, confirming the bearish sentiment.

The histogram is negative and widening, suggesting increasing bearish momentum.

No visible bullish divergence; price action aligns with momentum indicators.

Volume Analysis

There is no significant spike in volume, indicating the trend might not be affected by large institutional moves.

Low volume during this decline could either result in consolidation or a sudden shift if volume spikes.

No unusual spikes observed, suggesting the trend may continue unchanged.

Support & Resistance

Immediate support lies around 1.31200; if broken, the next zone may be around 1.30500.

Resistance is expected around recent consolidation zones near 1.32500.

This was a previous support level now turned resistance.

Actionable Insights

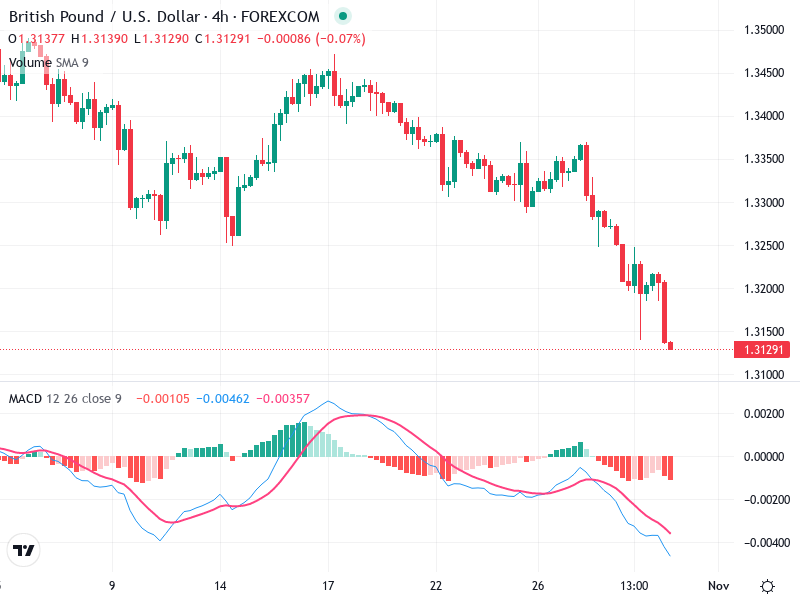
Consider shorting if support at 1.31200 breaks, with a stop loss above recent highs.

Hold current short positions as long as the price remains under key resistance levels.

Watch for bullish reversal patterns, increased volume, or MACD crossover for entry points.

The AI Technical Analysis Center is an informational tool only and does not constitute investment or trading advice.
This site is registered on wpml.org as a development site. Switch to a production site key to remove this banner.