Generic selectors
Exact matches only
Search in title
Search in content
Post Type Selectors

Popular stocks

Crypto

CFD

Currencies

Support

Gold

GOLD – Technical Analysis – 4h

October 30, 2025 17:03

Quick Summary

The gold Futures chart shows a dynamic interaction of trends and patterns. Initially exhibiting a strong uptrend, it peaks before transitioning into a downtrend. There is potential for a reversal indicating a pivotal junction for traders.

Candlestick Analysis

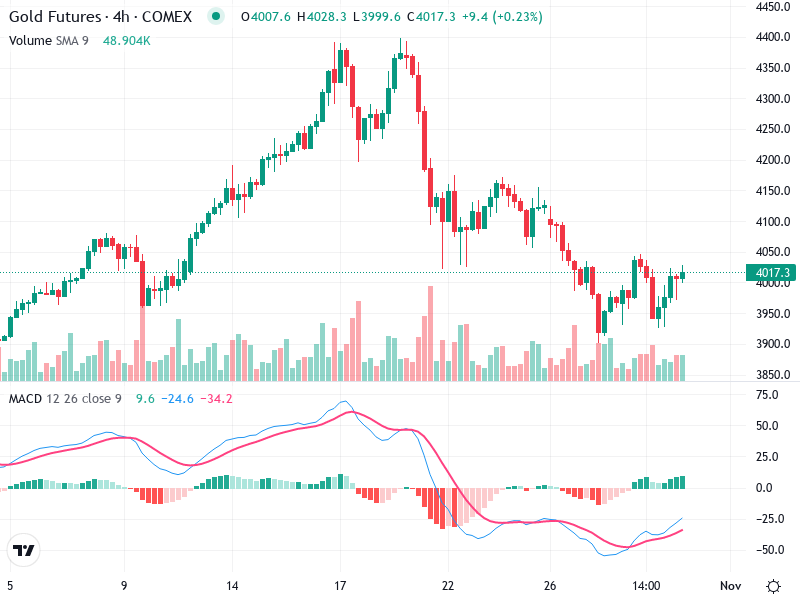
The chart initially shows a strong uptrend, which peaks before a clear downtrend, followed by a potential reversal with sideways movement near the end.

There seems to be a formation of a potential bullish reversal pattern at the bottom, like a hammer, but confirmation is needed.

The prominent red candles suggest bearish dominance post-peak.

MACD Analysis

The MACD line is crossing above the Signal line, indicating a bullish crossover.

Positive bars in the histogram suggest increasing bullish momentum, signaling a shift in sentiment.

There doesn’t appear to be significant divergence between MACD and price action on this timeframe.

Volume Analysis

There are noticeable spikes corresponding with certain price movements, particularly at the beginning of the downtrend.

The positive price movements currently are not strongly supported by volume spikes, suggesting caution.

Previous spikes around the downward movement may indicate institutional selling pressures.

Support & Resistance

Around the 3950 zone, which previously cushioned the price drop.

The 4028 level is a current key zone to watch for potential breakout or failure.

Breaking above resistance may lead to further price increases, while failure could see a retest of support levels.

Actionable Insights

Consider buying if price breaks above the 4028 resistance with higher volume, confirming the breakout.

If the price fails to sustain above 4028 and falls below support at 3950, possibilities of resuming downtrend.

In the current range with indecisive volume and candlestick patterns, holding might be prudent until a clearer trend emerges.

The AI Technical Analysis Center is an informational tool only and does not constitute investment or trading advice.
This site is registered on wpml.org as a development site. Switch to a production site key to remove this banner.