Generic selectors
Exact matches only
Search in title
Search in content
Post Type Selectors

Popular stocks

Crypto

CFD

Currencies

Support

Gold

NSDQ – Technical Analysis – 4h

October 31, 2025 08:00

Quick Summary

The chart analysis for the asset offers insights into current market dynamics. Observations indicate critical levels and patterns affecting future price movements.

Recent market trends suggest periods of consolidation as well as potential breakout opportunities.

Candlestick Analysis

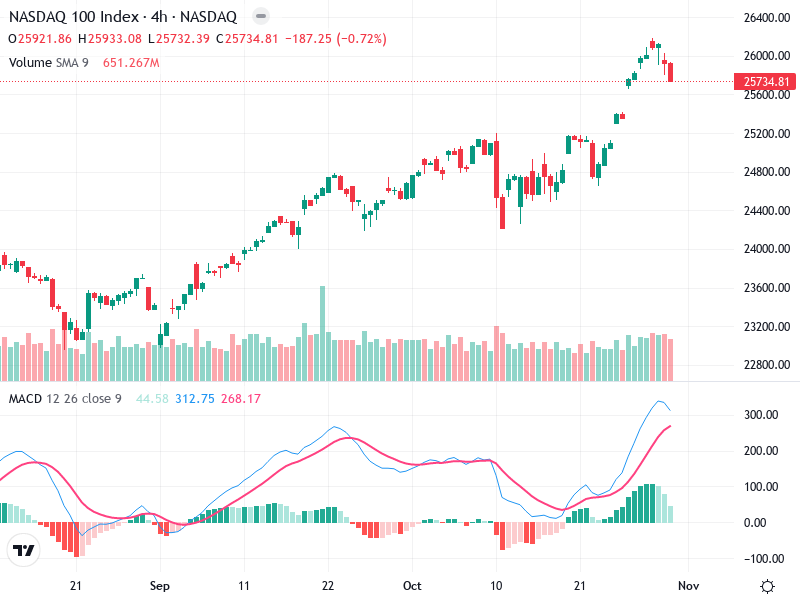
There's a visible pullback at the top, suggesting the end of a recent uptrend.

The last few candlesticks show a red candle indicative of a bearish move, possibly as part of a correction.

The area around 25,800-26,000 appears to be a critical level. A successful break above this could resume the bullish trend, while a pullback might target previous support levels.

MACD Analysis

The MACD line is above the signal line, indicating a bullish sentiment. However, they are converging, which could suggest weakening bullish momentum.

The histogram shows decreasing heights which suggest that bullish momentum could be fading.

No clear divergence with price action is noted, but the convergence of MACD and signal lines may warrant caution.

Volume Analysis

There's a noticeable increase in volume during the recent price decrease, suggesting selling pressure.

The increase in volume coupled with the price decline supports the bearish move and points toward a legitimate pullback rather than a temporary dip.

Spikes correspond with the price reaching recent highs, indicating potential institutional profit-taking.

Support & Resistance

Key support is around 25,000, a psychological and historical level that has been tested before.

The previous recent high around 26,000 is a clear resistance zone.

A break above could signal a continuation of the uptrend.

Actionable Insights

Consider buying if there's a clear breakout above 26,000 with strong volume support, confirming the resumption of the uptrend.

A breach below 25,500 with strong bearish volume could signal a good selling opportunity.

Holding may be appropriate if the price stabilizes between 25,500 and 26,000 without clear volume confirmation of a breakout/breakdown.

The AI Technical Analysis Center is an informational tool only and does not constitute investment or trading advice.
This site is registered on wpml.org as a development site. Switch to a production site key to remove this banner.