Generic selectors
Exact matches only
Search in title
Search in content
Post Type Selectors

Popular stocks

Crypto

CFD

Currencies

Support

Gold

OIL – Technical Analysis – 4h

November 3, 2025 17:00

Quick Summary

The asset shows a notable positive trend.

Recent patterns indicate potential for growth with key levels in focus.

Candlestick Analysis

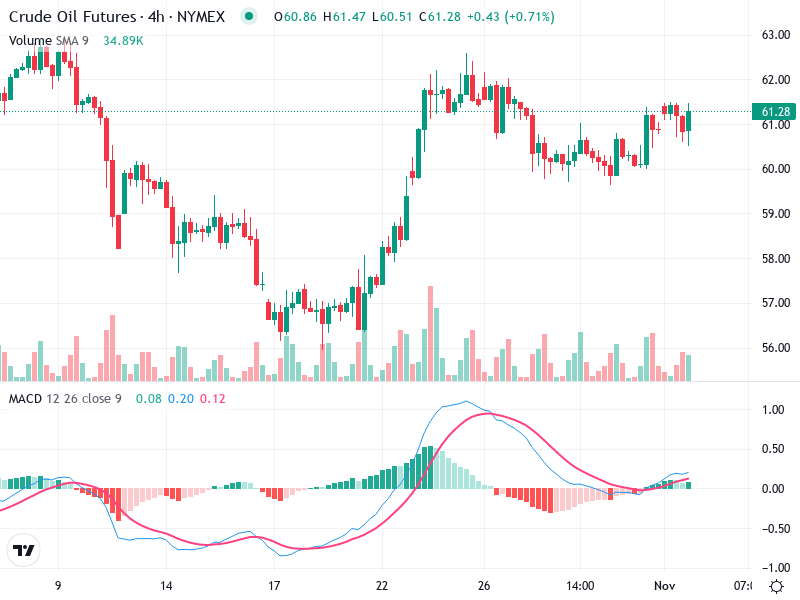
The chart displays a noticeable bullish trend with candlesticks forming higher highs and higher lows post-reversal around October 17th.

The trend is generally bullish, with a recent sideways movement suggesting consolidation.

Key breakout zone around 62.00, while a pullback could be expected if it drops below 60.50.

MACD Analysis

The MACD line is above the Signal line, indicating a bullish crossover around the end of the chart.

The histogram shows decreasing bearish momentum, confirming the recent bullish crossover tendency.

No significant divergence observed at present.

Volume Analysis

Volume spikes aligned with price increases around major breakouts suggest strong buying interest.

Higher volumes during upward movements indicate strong bullish sentiment.

Noticeable volume spikes correspond with price movements, potentially indicating institutional buying.

Support & Resistance

Key Support: Around 60.50, where the price has previously bounced upwards.

Key Resistance: 62.00, which has been tested multiple times and could lead to a breakout if surpassed.

Actionable Insights

Consider buying on breakouts above 62.00 with confirmation from increasing volume.

Watch for bearish patterns forming under 60.50 for potential sell signals.

Current sideways consolidation may suggest holding until clearer trend direction emerges.

The AI Technical Analysis Center is an informational tool only and does not constitute investment or trading advice.
This site is registered on wpml.org as a development site.