Generic selectors
Exact matches only
Search in title
Search in content
Post Type Selectors

Popular stocks

Crypto

CFD

Currencies

Support

Gold

NSDQ – Technical Analysis – 4h

November 4, 2025 08:00

Quick Summary

The NASDAQ 100 Index is currently showing signs of a bullish trend with potential for continuation. Recent price action and volume movements support this analysis, suggesting a possible breakout if certain conditions are met.

The index is currently nearing a key resistance level that could define its next directional move. Traders should remain vigilant as market conditions evolve.

Candlestick Analysis

The chart shows a series of green candlesticks forming a bullish trend leading up to the current level.

A recent cluster of smaller-bodied candles indicates a consolidation phase or potential indecision among traders.

The overall trend appears to be bullish, with higher highs and higher lows.

MACD Analysis

The MACD line is slightly above the Signal line, but both are showing signs of converging, indicating a weakening bullish momentum.

The MACD histogram shows decreasing bullish momentum as it starts to decline, suggesting potential consolidation or a minor pullback.

No significant divergence is observed at this point between the MACD and price action.

Volume Analysis

A noticeable increase in volume coincided with the recent upward movement, supporting the price rise.

Volume supports the bullish price movement, suggesting confirmation of the trend.

No unusual volume spikes that suggest strong institutional activity are currently visible beyond typical trading levels.

Support & Resistance

Key support level around 25,000 where previous consolidation and minor pullbacks were observed.

Key resistance level near 26,000 marking a potential resistance zone unless price can close significantly above it.

Recent price action around 25,900 could be a potential breakout zone if momentum continues upward.

Actionable Insights

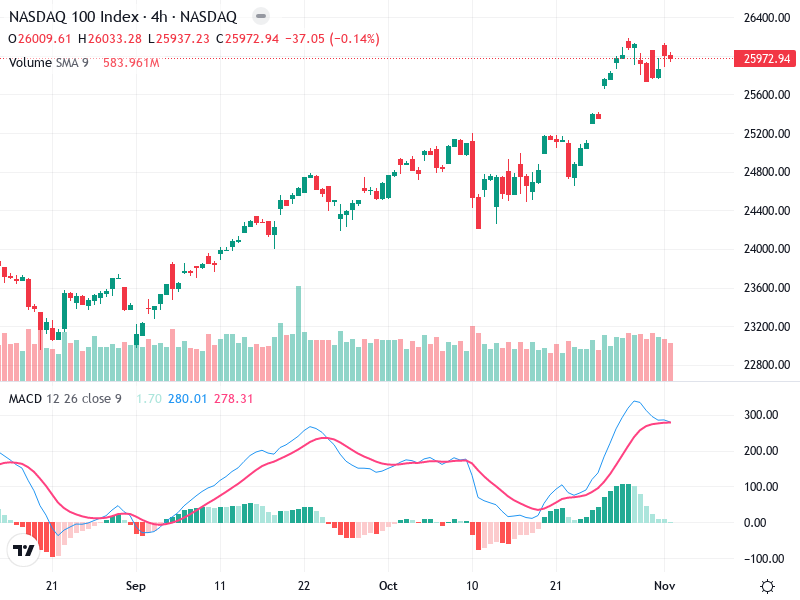
Consider buying if the price breaks convincingly above 26,000 with increased volume, confirming a continuation of the bullish trend.

If price starts to decline with increasing volume, it may indicate a break of current support, suggesting potential short opportunities or profit-taking.

Current holders should monitor for a breakout above resistance and watch for signs of trend exhaustion.

The AI Technical Analysis Center is an informational tool only and does not constitute investment or trading advice.
This site is registered on wpml.org as a development site.