Generic selectors
Exact matches only
Search in title
Search in content
Post Type Selectors

Popular stocks

Crypto

CFD

Currencies

Support

Gold

EUR/USD – Technical Analysis – 4h

November 4, 2025 08:02

Quick Summary

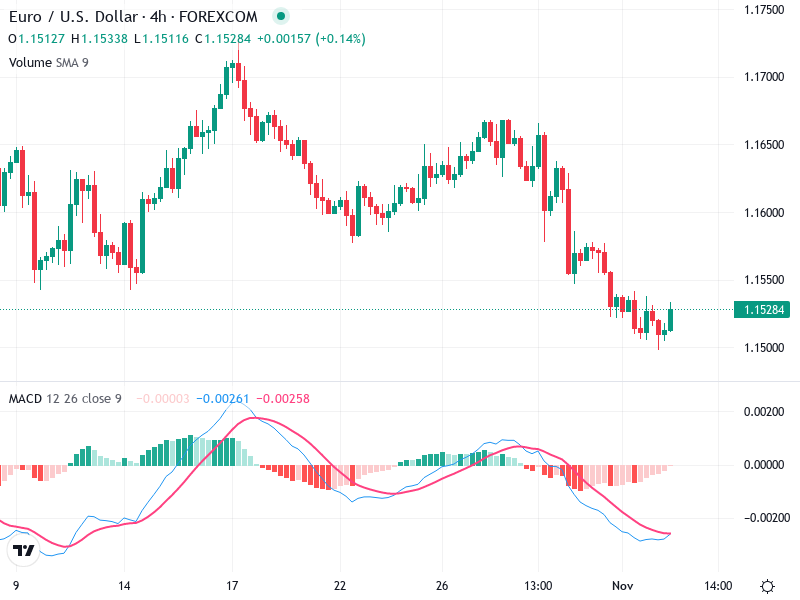
The technical chart analysis for the Asset shows various critical levels and potential opportunities. A detailed evaluation includes candlestick patterns, MACD, and volume analyses.

The Asset’s price action indicates crucial support and resistance zones that could influence future price movements.

Overall, the sentiment appears mixed with indications for both potential reversals and the continuation of current trends.

Candlestick Analysis

A potential hammer candlestick is forming at the recent support level around 1.1510, indicating a possible reversal from bearish to bullish sentiment.

Prior to this, the trend was predominantly bearish with consecutive red candles suggesting a strong downtrend.

The area around 1.1510 acts as a support zone, while resistance seems to be near 1.1600.

MACD Analysis

The MACD line is currently below the Signal line, indicating bearish momentum. However, they are converging, hinting at a possible bullish crossover.

The histogram is showing diminishing negative bars, suggesting a weakening bearish momentum.

No significant divergence is evident between MACD and price action.

Volume Analysis

There have been relatively consistent volume levels, with no major spikes indicating significant buying or selling by institutions.

The lack of volume during the downtrend could suggest a potential exhaustion of sellers as prices reached support.

Volume analysis shows that significant volume changes are necessary to validate any trend reversals.

Support & Resistance

Key support is around 1.1510, where recent price action appears to have bounced off.

Current resistance is near 1.1600. A break above this could signal further upside potential.

The chart demonstrates strong areas that may influence future price action.

Actionable Insights

Consider a cautious buy if there is a confirmed bullish candle above the current level with supportive volume.

Consider selling if the price closes below 1.1500 with increasing volume.

Monitor closely for a clear signal of a stronger trend reversal before making significant trades.

The AI Technical Analysis Center is an informational tool only and does not constitute investment or trading advice.
This site is registered on wpml.org as a development site.