Generic selectors
Exact matches only
Search in title
Search in content
Post Type Selectors

Popular stocks

Crypto

CFD

Currencies

Support

Gold

NSDQ – Technical Analysis – 4h

November 6, 2025 08:00

Quick Summary

The chart of has exhibited distinct trading behaviors in recent months.

Notably, the asset displayed a robust performance from late August to early October.

However, recent patterns suggest a shift towards consolidation or a potential reversal.

Candlestick Analysis

The chart shows a generally bullish trend from late August to early October. However, recent price action depicts a consolidation or potential reversal with a slight downward move.

There is a bearish engulfing pattern evident in the most recent candlesticks, suggesting potential further downside.

Prior candles showed strong bullish momentum but have recently stalled, indicating possible indecision.

MACD Analysis

A bearish crossover is observed with the MACD line crossing below the Signal line, suggesting a potential decrease in upward momentum.

The MACD histogram shows a decrease in positive momentum, supporting bearish sentiment.

No significant divergences are observed between the MACD and the actual price action, confirming the current trend.

Volume Analysis

There was a notable increase in volume on the last few days when prices declined, indicating selling pressure.

Volume spikes confirm the bearish candles, suggesting robust selling interest.

Recent spikes could imply institutional selling at recent highs.

Support & Resistance

The 25,700 level is a critical resistance zone; the price struggled to maintain above this, leading to a pullback.

The next key support is around the 25,200 level. A breach could lead to further declines toward the 24,800 area.

Actionable Insights

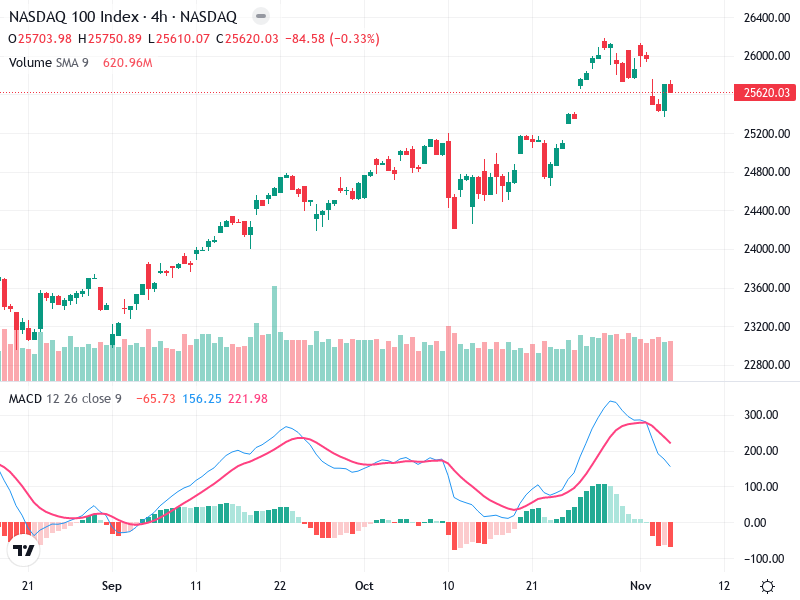
Consider short positions if the price fails to hold above the 25,200 support, especially with confirmation from a sustained bearish MACD and volume.

If holding long positions, monitor for any bullish reversal signals or strong support at 25,200.

Look for the MACD histogram to start showing a decrease in negative momentum or for bullish candlestick patterns near support levels for any reversal potential.

The AI Technical Analysis Center is an informational tool only and does not constitute investment or trading advice.
This site is registered on wpml.org as a development site. Switch to a production site key to remove this banner.