Generic selectors
Exact matches only
Search in title
Search in content
Post Type Selectors

Popular stocks

Crypto

CFD

Currencies

Support

Gold

NZD/USD – Technical Analysis – 4h

November 6, 2025 13:00

Quick Summary

The chart presents a detailed overview of the current market condition for the asset.

Recent patterns show signs of stabilization with clear support and resistance levels.

Technical indicators suggest potential shifts but require confirmation.

Candlestick Analysis

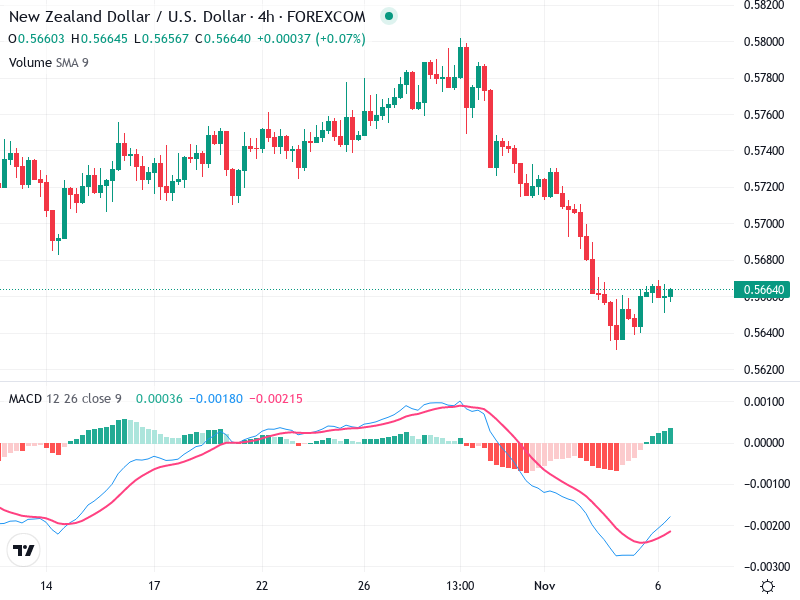
The chart shows a noticeable downtrend, recently halted by a cluster of small-bodied candles indicating potential indecision or consolidation.

The absence of distinct reversal patterns like hammers or bullish engulfing at the current level suggests caution.

The trend appears bearish, following a strong downtrend, with recent candlesticks implying a pause or potential consolidation phase.

MACD Analysis

The MACD line is moving upward toward the Signal line, suggesting reducing bearish momentum.

The histogram shows declining bearish momentum, indicating a potential shift or consolidation phase.

There are no significant divergences observed between the MACD and price action, aligning current price stabilization with the MACD’s behavior.

Volume Analysis

Volume is relatively stable, with no substantial surges indicating a lack of strong conviction in either direction.

The stable volume supports the consolidation seen in price, lacking significant buying or selling pressure.

No unusual spikes in volume suggesting institutional moves.

Support & Resistance

Key support level around 0.56200, where the price had recently stabilized before climbing slightly.

Key resistance level at the recent high near 0.57000, which could pose a challenge for any bullish momentum.

These levels define critical zones for potential movement in either direction.

Actionable Insights

Consider entry above 0.57000 with confirmation signals, such as increased volume or a bullish candlestick pattern.

If MACD fails to cross bullishly or price breaks support at 0.56200, it may trigger further downside moves.

Current consolidation suggests monitoring until a clearer trend direction is established.

The AI Technical Analysis Center is an informational tool only and does not constitute investment or trading advice.
This site is registered on wpml.org as a development site. Switch to a production site key to remove this banner.