Generic selectors
Exact matches only
Search in title
Search in content
Post Type Selectors

Popular stocks

Crypto

CFD

Currencies

Support

Gold

OIL – Technical Analysis – 4h

November 7, 2025 17:00

Quick Summary

The chart illustrates the current market status of the Asset, highlighting significant patterns and trends. The Asset is presently experiencing a bearish trend with some sideways movement, indicating potential consolidation phases.

However, the presence of certain patterns suggests possible upcoming changes in momentum and direction, which traders should be aware of.

Candlestick Analysis

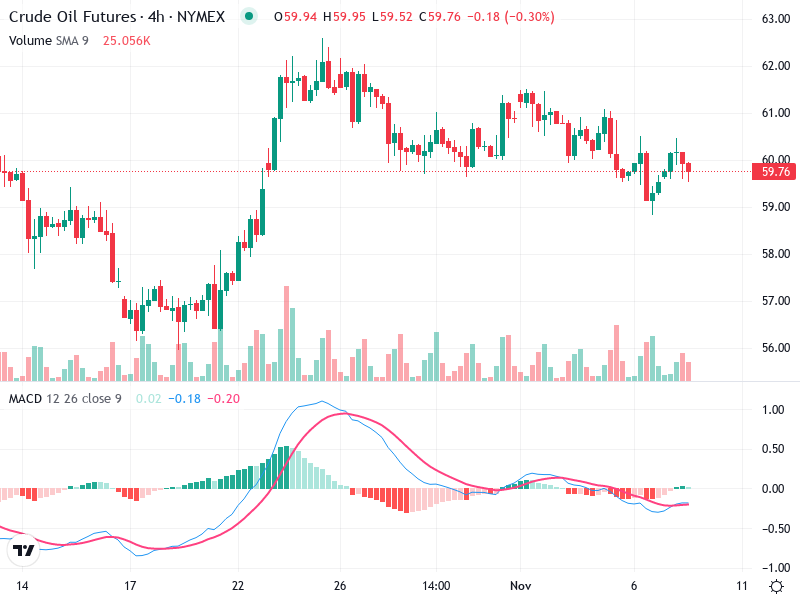
The chart shows a bearish trend transitioning into sideways movement. Prices have declined from previous highs and are now consolidating.

Near the end, there's a formation resembling a doji, which often indicates indecision in the market and could precede a reversal or continuation depending on confirmation from subsequent candles.

Earlier, there were bullish candles suggesting attempts at upwards movement that were not sustained.

MACD Analysis

The MACD line is slightly above the Signal line, indicating a recent bullish crossover. The lines are close together, suggesting weak momentum.

The histogram shows minimal green bars, suggesting low bullish momentum.

No significant divergence is apparent between the MACD and price action at this time.

Volume Analysis

There are several spikes in volume, notably during price declines, which supports the bearish trend.

The recent increase in volume accompanied price drops, indicating stronger selling pressure.

There are no clear signs of unusual volume spikes that signify significant institutional activity.

Support & Resistance

The area around 61 appears to be a resistance zone, as previous attempts to break higher were unsuccessful.

There is a notable support level near 59, where prices have recently rebounded.

Actionable Insights

Consider buying only if there is a strong bullish reversal pattern confirmed by increased volume and a sustained bullish MACD crossover.

Selling could be considered if the price breaks the support level at 59 with strong volume.

It may be wise to hold and watch for stronger signals due to the recent sideways movement.

The AI Technical Analysis Center is an informational tool only and does not constitute investment or trading advice.
This site is registered on wpml.org as a development site. Switch to a production site key to remove this banner.