Generic selectors
Exact matches only
Search in title
Search in content
Post Type Selectors

Popular stocks

Crypto

CFD

Currencies

Support

Gold

GOLD – Technical Analysis – 4h

November 7, 2025 17:02

Quick Summary

The gold Futures chart is currently showcasing a sideways trend following a recent bearish period. Investors are encouraged to keep an eye on potential stabilization signs in this transition phase.

MACD lines suggest emerging bullish momentum. However, volumes currently do not show strong support for this movement, reflecting overall indecisiveness in the market.

Candlestick Analysis

The overall trend appears sideways in the short term, following a previous bearish trend. This transition indicates potential stabilization after a downturn.

There aren't any remarkably distinct candlestick patterns such as bullish engulfing or doji in the most recent data. However, the presence of smaller candles and equal highs and lows suggests indecisiveness.

The price has been oscillating around the 4015-4050 zone, indicating this region as a potential breakout or pullback area.

MACD Analysis

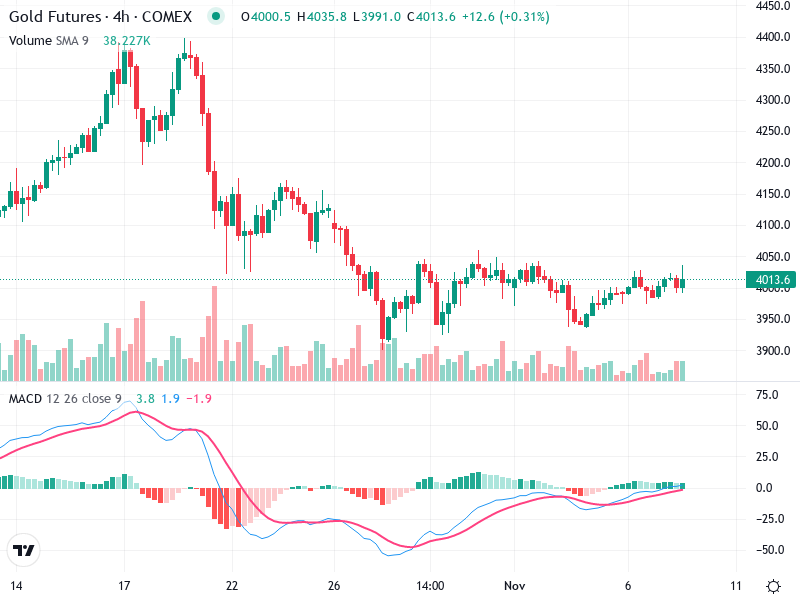
The MACD line is currently above the signal line, suggesting a short-term bullish crossover, indicating potential upward momentum.

The histogram shows waning bearish momentum with lower negative values transitioning closer to positive, supporting the idea of potential bullish sentiment emerging.

No strong divergences are noted between MACD and price action, meaning the current movements might be in line with the indicator.

Volume Analysis

Volume has been relatively stable, with no significant spikes suggesting that current price movement might not be strongly supported by trader conviction.

The lack of volume spikes during price movements supports the conclusion of sideways trading, reflecting indecisiveness.

No unusual volume spikes are present, indicating no strong hints of institutional activity at this moment.

Support & Resistance

Around 3990-4000 has been providing support, with the price repeatedly bouncing from this zone.

Resistance is observed around the 4035-4050 mark, with the price struggling to close above this range decisively.

This range forms the boundaries within which price has been confined, pointing towards a need for more decisive movement to identify longer-term direction.

Actionable Insights

Consider entries near support levels (around 3990) with a tight stop below this zone if bullish confirmation from volume or breakout occurs.

Opportunities present if price approaches resistance around 4035-4050 without breaking it, provided bearish candlestick patterns or volume spikes affirm trader sentiment.

If currently holding positions, monitoring for breakouts above resistance or breakdowns below support would be prudent.

The AI Technical Analysis Center is an informational tool only and does not constitute investment or trading advice.
This site is registered on wpml.org as a development site.