Generic selectors
Exact matches only
Search in title
Search in content
Post Type Selectors

Popular stocks

Crypto

CFD

Currencies

Support

Gold

NSDQ – Technical Analysis – 4h

November 10, 2025 08:00

Quick Summary

The NASDAQ 100 Index chart suggests a potential trend reversal following a recent pullback. The index had been consistently making higher highs and higher lows, indicating a bullish phase until the recent downturn. A notable bullish candlestick towards the chart’s end, accompanied by volume dynamics, highlights the possibility of market recovery.

Candlestick Analysis

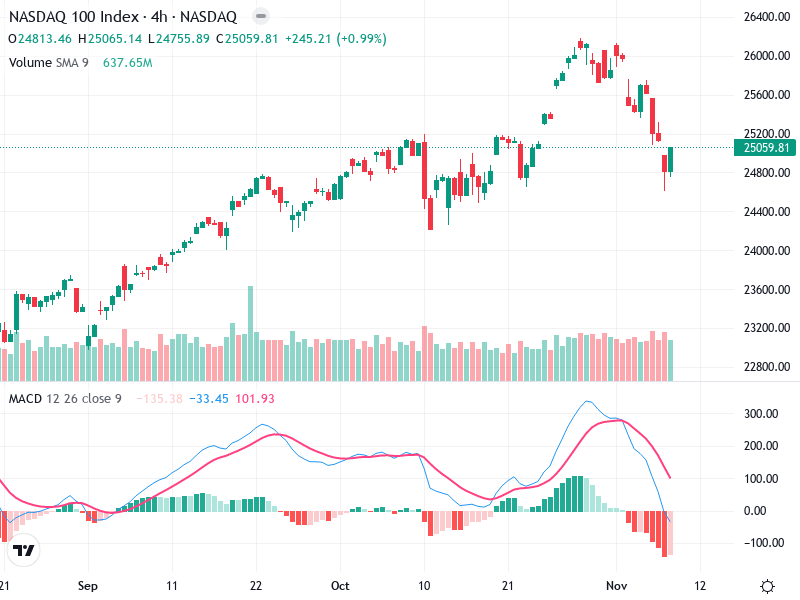
The chart shows a recent pullback within an overall uptrend. The price had been making higher highs and higher lows until the recent downturn.

There is a notable bullish candlestick at the end of the chart, suggesting a potential reversal. This could be the beginning of a recovery if confirmed by subsequent price action.

The area around 24,800 appears to be a key pullback zone, serving as a temporary support in recent sessions.

MACD Analysis

The MACD line is below the Signal line, indicating a bearish trend. However, the gap is starting to narrow, which could indicate a potential future crossover.

The histogram shows diminishing negative momentum, which might suggest waning bearish momentum.

There is no clear divergence between the MACD and price action currently.

Volume Analysis

Steady volume seen throughout the chart, with a slight increase during the recent downturn.

The recent bullish candlestick is supported by a moderate volume increase, which may suggest interest in buying at these lower levels.

No significant volume spikes suggesting extreme institutional activity.

Support & Resistance

Key support is evident around 24,800, where price has shown to bounce back.

Immediate resistance lies at the 25,500 - 25,600 range where prior price struggled to break through.

Actionable Insights

Consider holding existing positions until there is a confirmation of trend reversal with a bullish MACD crossover or bullish candlestick pattern above the recent resistance.

Aggressive traders may consider a speculative buy if the bullish signal is confirmed with increased volume.

Look for a MACD crossover to confirm a bullish trend resumption. Monitor the resistance zone for potential breakout.

The AI Technical Analysis Center is an informational tool only and does not constitute investment or trading advice.
This site is registered on wpml.org as a development site. Switch to a production site key to remove this banner.