Generic selectors
Exact matches only
Search in title
Search in content
Post Type Selectors

Popular stocks

Crypto

CFD

Currencies

Support

Gold

EUR/USD – Technical Analysis – 4h

November 10, 2025 08:02

Quick Summary

The chart reveals key insights into market behavior over recent periods. The asset has experienced a shift in trend, providing potential opportunities for traders. Analyzing key indicators offers insights into future price actions.

Candlestick Analysis

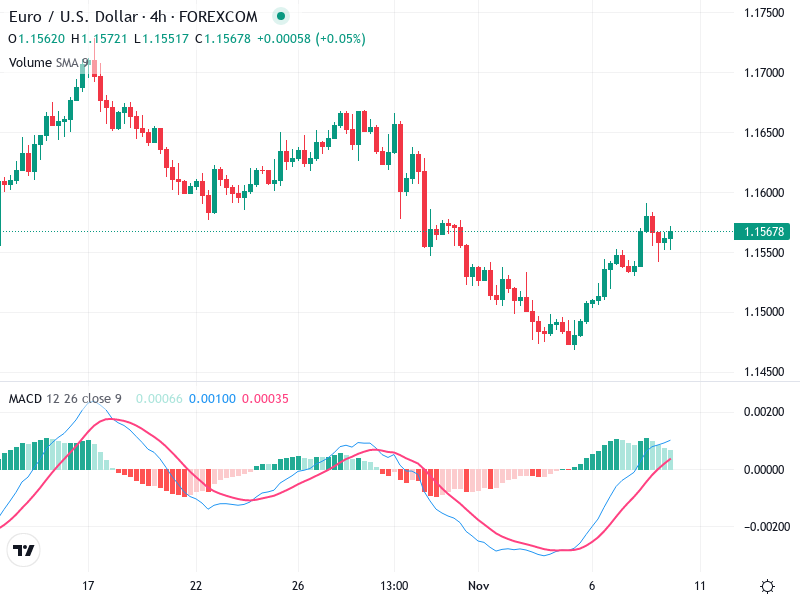
A bullish reversal is noticeable after a period of downtrend, marked by several bullish candlesticks. There is a potential bullish engulfing pattern around the November low, suggesting buyer interest.

The recent candles display some indecision, indicating consolidation.

The overall trend has shifted from bearish to a slight bullish recovery. Current price action is showing a slight upward momentum after a recent trough.

MACD Analysis

The MACD line is above the Signal line, signaling a recent bullish crossover.

Green bars on the histogram confirm positive momentum, although the decrease in size suggests weakening bullish momentum.

No significant divergences are evident between the MACD and price action at this time.

Volume Analysis

Volume generally increased during the reversal, supporting the recent uptrend.

Volume appears to confirm the upward price movement, though current volumes are not exceptionally high, hinting that the momentum might not be strong.

There's no indication of unusual volume spikes suggesting institutional buying at present.

Support & Resistance

Immediate support is observed around 1.1500, which aligns with previous lows.

Key resistance is near 1.1600, where price action previously reversed, making it crucial for further bullish confirmation.

The area around 1.1560 represents a potential pullback level where price retraced after its recent high.

Actionable Insights

Consider potential buy positions if price holds above the 1.1500 support and MACD momentum strengthens, especially if accompanied by higher volume.

If currently holding, monitor for price stability above the recent lows to validate the recovery.

Watch for bearish signals such as MACD crossover or break below 1.1500 before considering selling.

The AI Technical Analysis Center is an informational tool only and does not constitute investment or trading advice.
This site is registered on wpml.org as a development site. Switch to a production site key to remove this banner.