Generic selectors
Exact matches only
Search in title
Search in content
Post Type Selectors

Popular stocks

Crypto

CFD

Currencies

Support

Gold

AUD/USD – Technical Analysis – 4h

November 10, 2025 13:02

Quick Summary

The AUD/USD 4-hour chart showcases intriguing dynamics with potential for change.

An examination of the technical indicators suggests possible bullish momentum if certain conditions align.

This analysis dives into pivotal areas including candlesticks, MACD, volume, and support/resistance levels for comprehensive insights.

Candlestick Analysis

The chart shows a recent bullish reversal with a series of green candles, suggesting buying pressure.

The trend appears to be recovering from a bearish phase, indicating a potential shift towards a bullish trend.

The area around 0.65400 is significant, acting as a resistance zone which the price is currently testing.

MACD Analysis

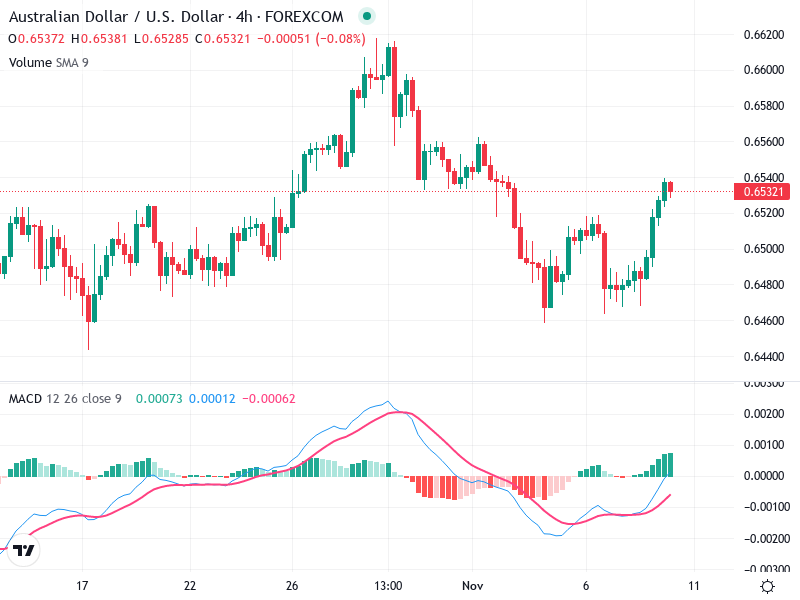
The MACD line is above the Signal line, indicating a bullish crossover, which suggests potential upward momentum.

The histogram shows increasing positive bars, supporting the bullish momentum.

No significant divergences observed between MACD and price action, which suggests that the current price move is supported by momentum.

Volume Analysis

Volume appears relatively stable with no significant spikes, indicating a steady buying force rather than institutional activity.

The recent price increase is supported by modest volume, suggesting potential for continuation if volume increases.

No significant divergences observed between volume and price action, supporting steady upward momentum.

Support & Resistance

Resistance at 0.65400. A break above this could lead to further upward movement.

Support is observed around 0.64800. This level needs to hold to prevent further downside risk.

Monitoring of these levels is crucial for confirming the continuation of the trend.

Actionable Insights

Consider buying on a confirmed break above 0.65400 with increased volume and a bullish MACD continuation.

Watch for potential bearish reversal signals around 0.65400 if resistance holds, particularly if accompanied by bearish MACD divergence.

Confirmation of bullish trend through stronger volume and sustained MACD bullish crossover is key.

The AI Technical Analysis Center is an informational tool only and does not constitute investment or trading advice.
This site is registered on wpml.org as a development site. Switch to a production site key to remove this banner.