Generic selectors
Exact matches only
Search in title
Search in content
Post Type Selectors

Popular stocks

Crypto

CFD

Currencies

Support

Gold

GBP/USD – Technical Analysis – 4h

November 10, 2025 13:04

Quick Summary

The GBP/USD chart indicates a potential bullish movement.

Recent price action suggests the asset is attempting a reversal.

Main focus is on the resistance level at 1.3200.

Candlestick Analysis

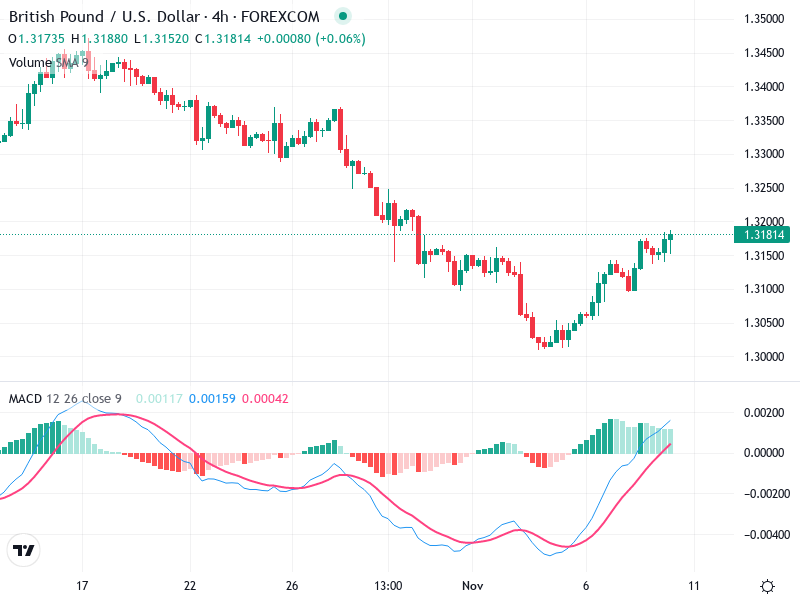
The chart shows a prior downtrend, followed by a consolidation phase. The recent candles indicate a potential bullish reversal as prices have started to rise.

There is evidence of a bullish engulfing pattern occurring near the bottom, suggesting a possible reversal. No significant doji or hammer patterns are immediately visible.

The price appears to be testing a minor resistance around 1.3180, suggesting a potential breakout may be forming.

MACD Analysis

The MACD line has crossed above the signal line, indicating a bullish crossover. This suggests upward momentum.

The histogram bars are positive and increasing, reflecting strengthening bullish momentum.

There are no visible divergences between the MACD and price action, supporting the current upward movement.

Volume Analysis

Volume appears consistent, with no notable spikes that contrast with the price movements.

The volume remains moderate, neither confirming nor contradicting the recent upward price action. Institutional activity is not strongly indicated due to lack of volume spikes.

Support & Resistance

Key support is observed around 1.3100, where prior consolidation occurred.

Immediate resistance appears at approximately 1.3200, where previous highs were located. Breaking this could lead to further upside.

Actionable Insights

Consider initiating a long position if the price breaks and closes above the 1.3200 resistance with sustained volume.

Be cautious of a false breakout; a failure to hold above 1.3200 might signal a short-term pullback to support levels around 1.3100.

Monitor for confirmation of the breakout with increased volume or additional bullish candlestick formations.

The AI Technical Analysis Center is an informational tool only and does not constitute investment or trading advice.
This site is registered on wpml.org as a development site. Switch to a production site key to remove this banner.