Generic selectors
Exact matches only
Search in title
Search in content
Post Type Selectors

Popular stocks

Crypto

CFD

Currencies

Support

Gold

OIL – Technical Analysis – 4h

November 10, 2025 17:00

Quick Summary

The 4-hour chart for Crude Oil Futures indicates a transition from a bullish to a bearish trend. Prices have been moving sideways, reflecting potential market indecision. Key levels at $59.50 and $60.50-$61.00 provide insight into potential support and resistance.

Candlestick Analysis

The overall trend seems to be transitioning from bullish to bearish, with prices recently moving sideways.

No prominent bullish or bearish patterns like engulfing or hammers are immediately evident. However, there is a potential base forming around the $59.50 level, indicating a possible support zone.

The price action is currently testing the $59.50 zone, hinting at a possible pullback if the level holds.

MACD Analysis

The MACD line is close to the signal line, indicating potential consolidation or a modest bearish crossover. This suggests a weak momentum on the downside.

The histogram is slightly negative, highlighting a potential lack of strong bullish momentum.

There are no clear divergences between the MACD and price action, which indicates the current trend is supported by momentum indicators.

Volume Analysis

The volume appears to be decreasing over time, which might suggest a waning interest or a calm before a potential large move.

Lower volume on declining prices could mean consolidation, as opposed to strong bearish sentiment.

There are no visible unusual spikes that suggest significant institutional activity at this point.

Support & Resistance

The key support level is around $59.50, where prices seem to hover and find temporary stability.

Resistance is likely around the $60.50 to $61.00 range, where previous attempts to rise have been halted.

Actionable Insights

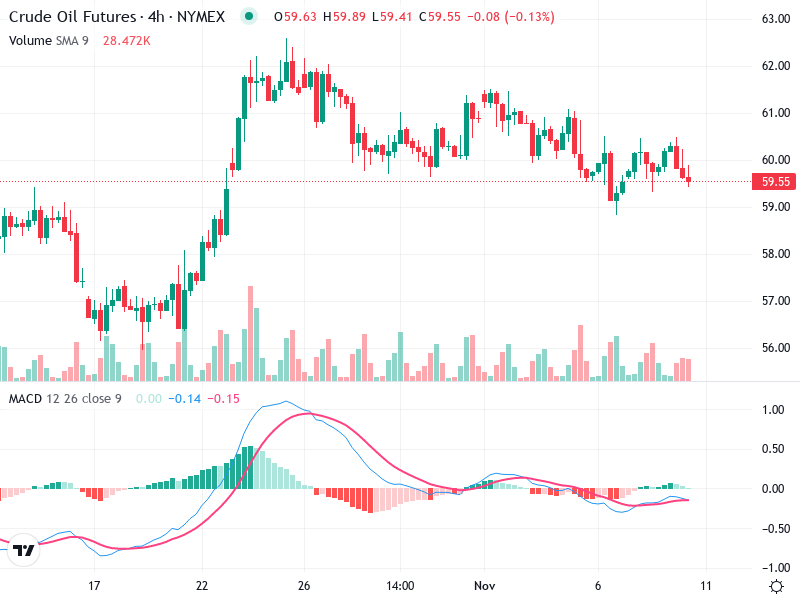
Given the consolidation signals, it might be a good time to hold or observe before entering. Await confirmation of a bounce from the $59.50 level for potential buying opportunities, or a break below for possible shorts.

Watch for any strong volume movement which might confirm a breakout direction, and closer MACD crossovers indicating momentum shifts.

The recent lack of clear direction suggests traders are uncertain, likely waiting for external factors to provide direction.

The AI Technical Analysis Center is an informational tool only and does not constitute investment or trading advice.
This site is registered on wpml.org as a development site. Switch to a production site key to remove this banner.