Generic selectors
Exact matches only
Search in title
Search in content
Post Type Selectors

Popular stocks

Crypto

CFD

Currencies

Support

Gold

NSDQ – Technical Analysis – 4h

November 12, 2025 08:00

Quick Summary

The asset is witnessing a potential transition phase in its market sentiment.

It’s important to watch key indicators like MACD and volume spikes for stronger directional cues.

Technical levels are proving crucial for anticipating future market movements.

Candlestick Analysis

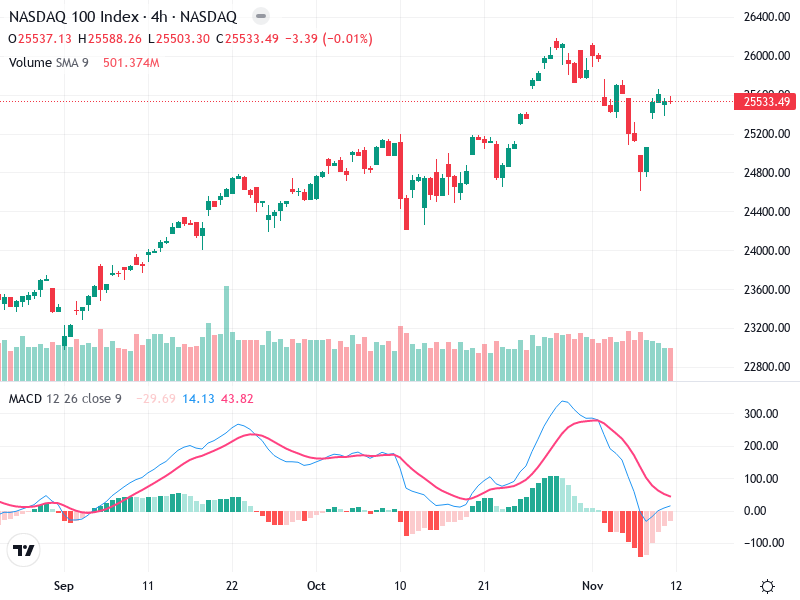
Recent candlesticks show potential for a bullish reversal with a possible formation resembling a hammer at the low point, indicating buying interest at lower levels.

The market was previously in a bullish trend but has recently faced a correction. The short-term trend is attempting to stabilize, suggesting potential sideways movement or a rebound.

The area around 25,200 appears to be a recent support level after the pullback, while the previous high near 26,000 may act as resistance.

MACD Analysis

The MACD line is below the signal line, indicating a bearish crossover recently. However, it appears to be converging towards a potential bullish crossover if momentum shifts.

The histogram shows decreasing negative momentum, suggesting that bearish strength is weakening, potentially leading to a bullish reversal.

No clear divergence is observed, but the reducing bearish momentum is an encouraging sign.

Volume Analysis

Volume spiked during the recent correction, indicating possible institutional activity or panic selling. Recent volumes are stabilizing at lower levels, matching the price consolidation.

The high volume during the drop suggests strong selling pressure, but the stabilization in volume may support the price finding a bottom.

Significant volume spikes coincide with price lows, which could indicate accumulation by larger players.

Support & Resistance

Strong support appears around the 25,200 level, which has been tested multiple times.

Key resistance is near 26,000, a previous peak that could challenge upward movement.

Actionable Insights

Consider buying if the price confirms a reversal with a close above 25,600 accompanied by increasing volume.

Caution if the price breaks below 25,200 with accompanying high volume.

Hold positions if the price remains between the 25,200 and 26,000 levels, as it indicates consolidation.

The AI Technical Analysis Center is an informational tool only and does not constitute investment or trading advice.
This site is registered on wpml.org as a development site. Switch to a production site key to remove this banner.