Generic selectors
Exact matches only
Search in title
Search in content
Post Type Selectors

Popular stocks

Crypto

CFD

Currencies

Support

Gold

NZD/USD – Technical Analysis – 4h

November 12, 2025 13:01

Quick Summary

The NZD/USD chart is showing signs of potential reversal as it transitions from a recent downtrend to a sideways range. Asset price movements suggest consolidation, highlighting key levels of support and resistance.

Insights from technical indicators provide a cautious yet optimistic outlook for future price movement.

Candlestick Analysis

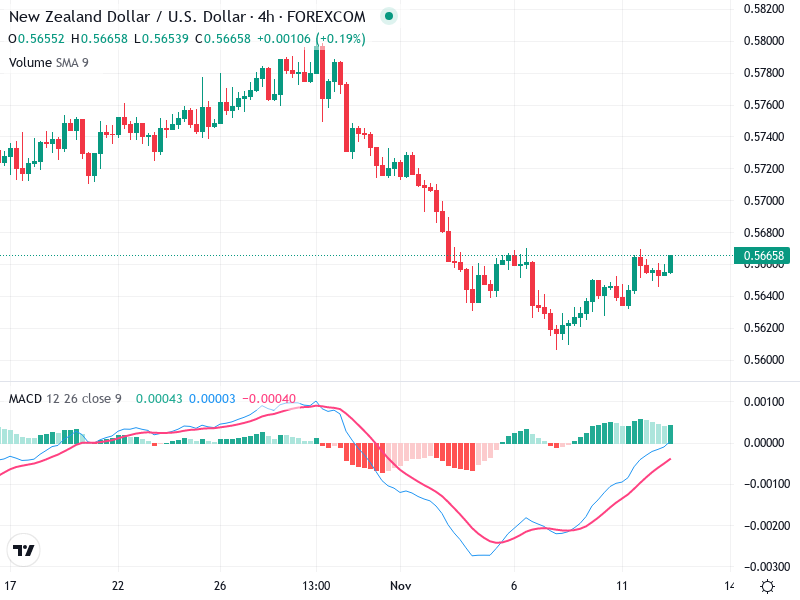
The chart displays a potential bullish engulfing pattern near the end of the downtrend, indicating a possible reversal.

Several small-bodied candles and a doji suggest indecision and a potential change in trend.

Recently, the chart has moved from a downtrend into a sideways range, marking a consolidation phase.

MACD Analysis

The MACD line has crossed above the Signal line, showing a recent bullish crossover.

The MACD histogram is steadily turning green, reflecting growing bullish momentum.

A potential bullish divergence is noted as the price makes a lower low while the MACD shows a higher low.

Volume Analysis

Volume remains relatively low during sideways movement, indicating a lack of strong selling pressure.

During consolidation, volume does not support a strong bearish move, aligning with potential reversal patterns.

No unusual volume spikes are observed that would suggest immediate institutional interest.

Support & Resistance

Key support is identified around the 0.5620 region, where price has previously bounced.

Significant resistance is at the 0.5680 level. A break above this could signal a stronger recovery.

Monitoring these levels is crucial for understanding potential price movements.

Actionable Insights

Consider a buy strategy on a confirmed breakout above 0.5680 with strong volume.

If the price returns below 0.5620 with increased volume, it might signal a continuation of the downtrend.

Watch for confirmation of bullish reversal with sustained momentum on the MACD and increased volume during up days.

The AI Technical Analysis Center is an informational tool only and does not constitute investment or trading advice.
This site is registered on wpml.org as a development site. Switch to a production site key to remove this banner.