Generic selectors
Exact matches only
Search in title
Search in content
Post Type Selectors

Popular stocks

Crypto

CFD

Currencies

Support

Gold

GOLD – Technical Analysis – 4h

November 13, 2025 17:03

Quick Summary

The asset is showing significant bullish trends as evidenced by recent chart movements. Close attention to support and resistance levels will be crucial in the coming days.

Maintaining above key levels suggests positive momentum for future price action.

Candlestick Analysis

The overall trend appears to be bullish. The price has been making higher lows and higher highs since early November.

Recently, there is a pullback after a strong bullish movement, characterized by bullish candlesticks.

A breakout above the 4200 level was confirmed and is currently being tested as support.

MACD Analysis

The MACD line is above the Signal line, indicating bullish momentum.

The histogram shows declining positive momentum, suggesting a slowdown in the recent price increase.

No significant divergence is noted between MACD and price action, maintaining overall bullishness.

Volume Analysis

Volume has generally increased with upward price movements, validating the bullish trend.

Noticeable volume spikes during price increases indicate possible institutional buying, which supports the bullish case.

Recent volume appears to be stabilizing, suggesting cautious optimism in the market.

Support & Resistance

The 4200 level acts as a key support zone, holding after previous resistance was broken.

The next major resistance appears near the 4250 level, where recent gains might face tests.

Monitoring these levels will be important for anticipating future price movements.

Actionable Insights

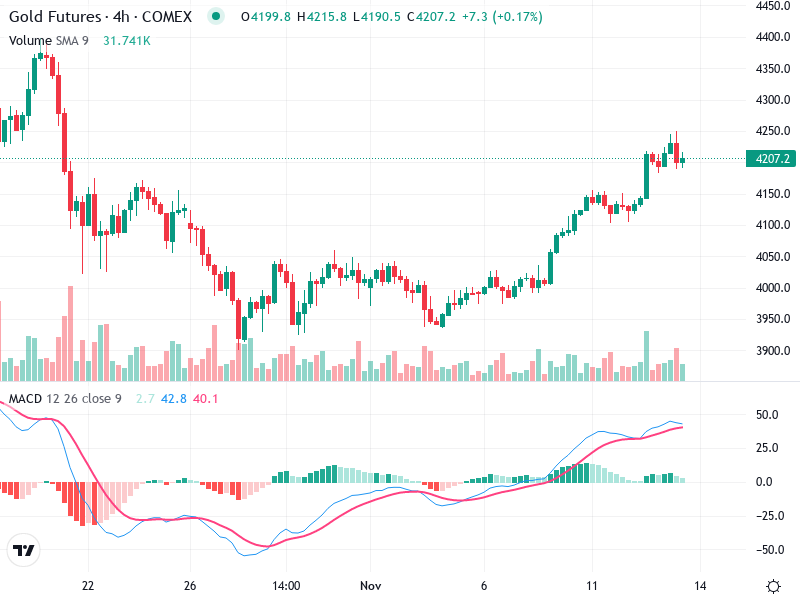
Considering the current bullish trend and support at 4200, a potential buy could be considered if prices remain above this level, with a stop loss just below it to manage risk.

Continued volume support and momentum in the MACD are crucial, with attention to any new bearish crossovers that might indicate a change.

Be cautious of false breakouts or sudden shifts in volume that may indicate market manipulation.

The AI Technical Analysis Center is an informational tool only and does not constitute investment or trading advice.
This site is registered on wpml.org as a development site. Switch to a production site key to remove this banner.