Generic selectors
Exact matches only
Search in title
Search in content
Post Type Selectors

Popular stocks

Crypto

CFD

Currencies

Support

Gold

GBP/USD – Technical Analysis – 4h

November 14, 2025 13:04

Quick Summary

The GBP/USD 4-hour chart shows significant patterns developing, particularly noticeable is the transition from a recent downtrend to a sideways movement.

Market sentiment remains cautious as traders await further movements that could indicate a breakout or continuation of the current trend.

Candlestick Analysis

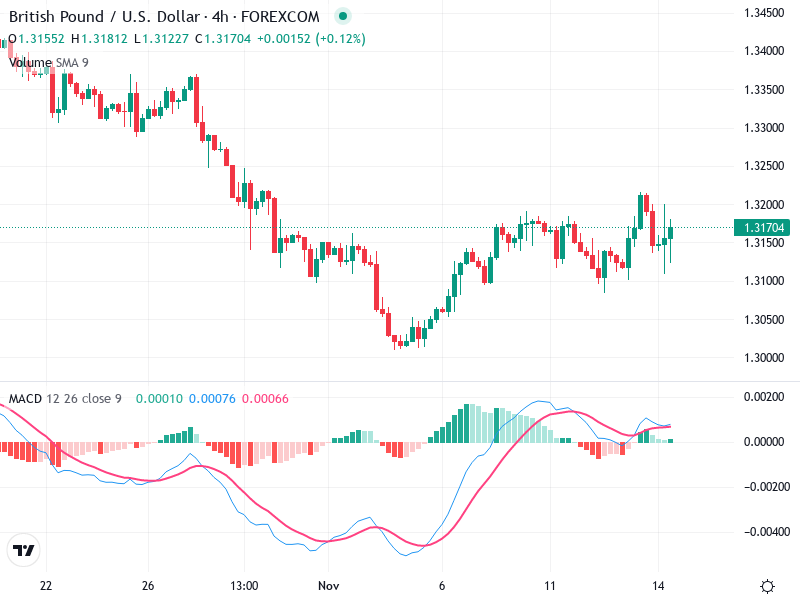
There is evidence of a bullish engulfing pattern occurring in early November, indicating a potential reversal from a previous downtrend.

A doji pattern appears more recently, suggesting market indecision at current levels.

The trend before November was predominantly bearish, followed by a sideways movement with some bullish attempts.

MACD Analysis

There recently was a bearish crossover as the MACD line crossed below the Signal line.

The MACD histogram is slightly negative, indicating weakening bullish momentum.

There's a potential bullish divergence noted as prices are consolidating sideways while the MACD starts to flatten out.

Volume Analysis

Volume was higher during the sell-off phase of the chart and appears to decrease in the consolidation phase.

The rising volume during the decline supports the bearish momentum initially; however, recent lower volumes during the sideways trend may not strongly back any significant price moves.

No significant unusual spikes that suggest strong institutional activity.

Support & Resistance

Key support level around 1.31000, which has held through the recent consolidation phase.

Strong resistance near 1.32000, which has been tested but not convincingly broken.

Traders should monitor these levels closely for potential breakouts.

Actionable Insights

Consider a hold strategy for now, as the market is consolidating with no clear breakout.

A buy would be considered if there is a sustained breakout above 1.32000 with increased volume.

A sell might be contemplated if the price breaks below the 1.31000 support zone with a bearish pattern confirmation.

The AI Technical Analysis Center is an informational tool only and does not constitute investment or trading advice.
This site is registered on wpml.org as a development site. Switch to a production site key to remove this banner.