Generic selectors
Exact matches only
Search in title
Search in content
Post Type Selectors

Popular stocks

Crypto

CFD

Currencies

Support

Gold

OIL – Technical Analysis – 4h

November 14, 2025 17:01

Quick Summary

The chart for shows a tentative upward trend, indicating potential bullish movement. Key resistance and support levels add to its analysis.

The asset fluctuates around significant price points, suggesting careful monitoring for breakout opportunities.

Candlestick Analysis

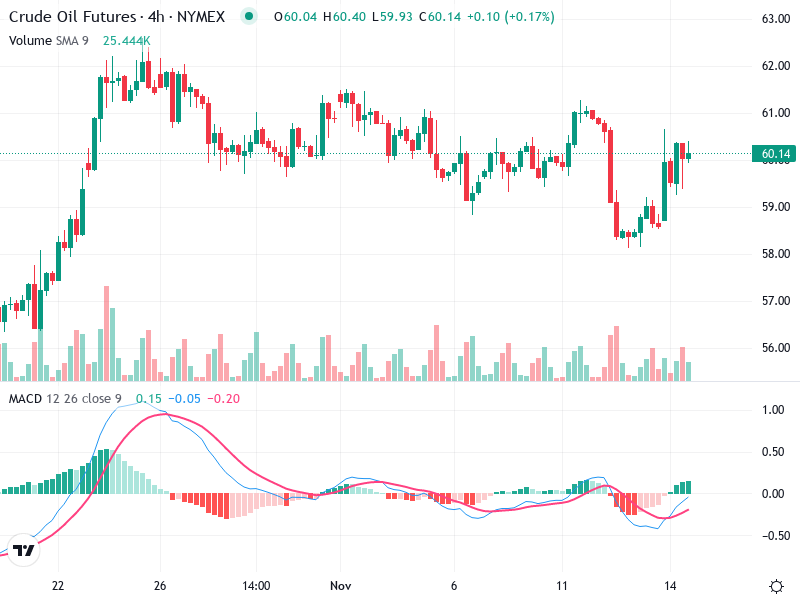
The chart shows an overall sideways to slightly bullish trend with periods of fluctuations around the $60-$61 mark.

There's a recent formation of a bullish engulfing pattern indicating potential upward momentum. Earlier, a few doji patterns suggest indecisiveness at those points.

A breakout zone can be identified just above $61, which was tested multiple times and acted as resistance. A pullback zone is seen around $58.

MACD Analysis

The MACD line is approaching a bullish crossover above the Signal line, indicating a possible positive momentum shift.

The MACD histogram is showing a gradual increase in positive bars, suggesting strengthening bullish momentum.

There are no clear divergences visible at this time; the MACD is aligning with the price action.

Volume Analysis

There was a notable volume spike during the most recent price increase, which supports the upward move, indicating strong buyer interest.

Spikes in volume during periods of price increases suggest potential institutional buying.

Support & Resistance

The key resistance level is $61, which has been tested but not yet broken. A breakout above this could signify further gains.

The support level is around $58, which held firm during previous downswings and may act as a floor for further bearish attempts.

Actionable Insights

Consider buying if the price convincingly breaks above $61 with increased volume, supported by a continued bullish MACD crossover.

Watch for a rejection at $61 and a bearish reversal pattern as a potential shorting opportunity.

If positions are already held, it might be prudent to wait for a decisive breakout or a clear MACD signal.

The AI Technical Analysis Center is an informational tool only and does not constitute investment or trading advice.
This site is registered on wpml.org as a development site. Switch to a production site key to remove this banner.