Generic selectors
Exact matches only
Search in title
Search in content
Post Type Selectors

Popular stocks

Crypto

CFD

Currencies

Support

Gold

GOLD – Technical Analysis – 4h

November 14, 2025 17:03

Quick Summary

The chart of gold Futures illustrates a recent sharp decline following a brief bullish phase. A bearish engulfing pattern suggests a potential reversal, while the long lower shadow indicates buyer interest at lower levels.

Support and resistance levels are key, especially the 4150 and 4060 marks, which could guide future price action.

Candlestick Analysis

The chart indicates a recent sharp decline after a short bullish trend, evidenced by the series of green candles prior to the drop.

A potential bearish engulfing pattern appears near the top before the decline, which typically signals a reversal or continuation of a downtrend.

The latest candlestick shows a long lower shadow, suggesting some buying support at lower levels.

MACD Analysis

A bearish crossover is observed where the MACD line crosses below the Signal line, indicating potential bearish momentum.

The histogram is increasing in negative territory, signaling strengthening downward momentum.

No significant divergence is noted between price and MACD, affirming the current bearish trend from the MACD perspective.

Volume Analysis

Significant volume increase occurs on the current decline, which can suggest strong selling pressure.

High volume on downward movements typically indicates confirmation of the bearish move.

The previous upward move did not significantly increase volume, suggesting a weaker bullish commitment prior to the reversal.

Support & Resistance

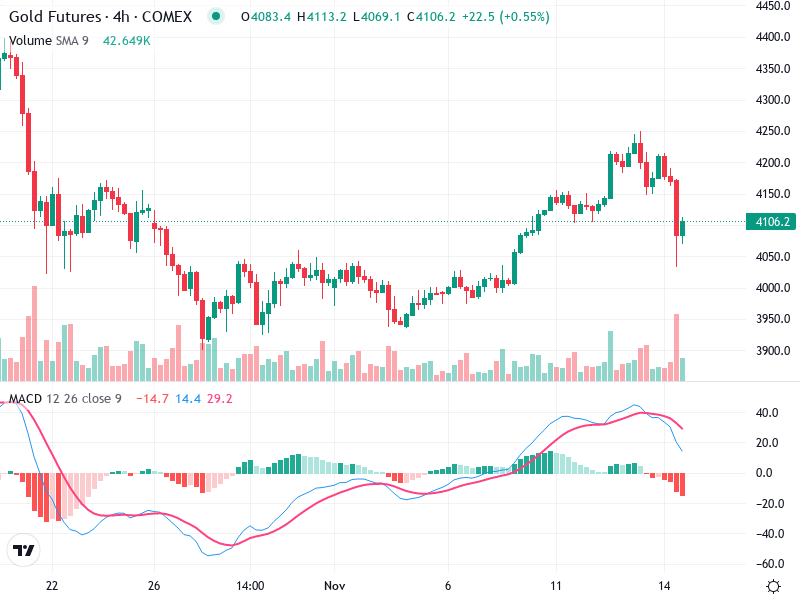
Support appears around the 4060 level, marked by the long lower shadow of the recent candle.

Immediate resistance is likely at the 4150 level, formerly broken support, now a potential barrier on upward retracement.

Breaches of these levels could signal strong trends in either direction. Maintaining above 4150 could re-establish bullish bias; falling below 4060 could intensify bearish sentiment.

Actionable Insights

Consider entering only if there's a confirmation of support hold at 4060 and a reversal signal like a bullish candle pattern.

Opportunities likely exist now, with stop-loss above 4150 in case of a bullish reversal.

Advisable for those in already short positions to wait for a test of the lower support level.

The AI Technical Analysis Center is an informational tool only and does not constitute investment or trading advice.
This site is registered on wpml.org as a development site. Switch to a production site key to remove this banner.