Generic selectors
Exact matches only
Search in title
Search in content
Post Type Selectors

Popular stocks

Crypto

CFD

Currencies

Support

Gold

AUD/USD – Technical Analysis – 4h

November 17, 2025 13:03

Quick Summary

The chart demonstrates a mixture of different candlestick patterns, with no single pattern dominating the scene.

The overall trend indicates a sideways to slightly bullish movement, marked by an upward phase followed by consolidation.

Key levels have been identified for potential breakout and pullback scenarios.

Candlestick Analysis

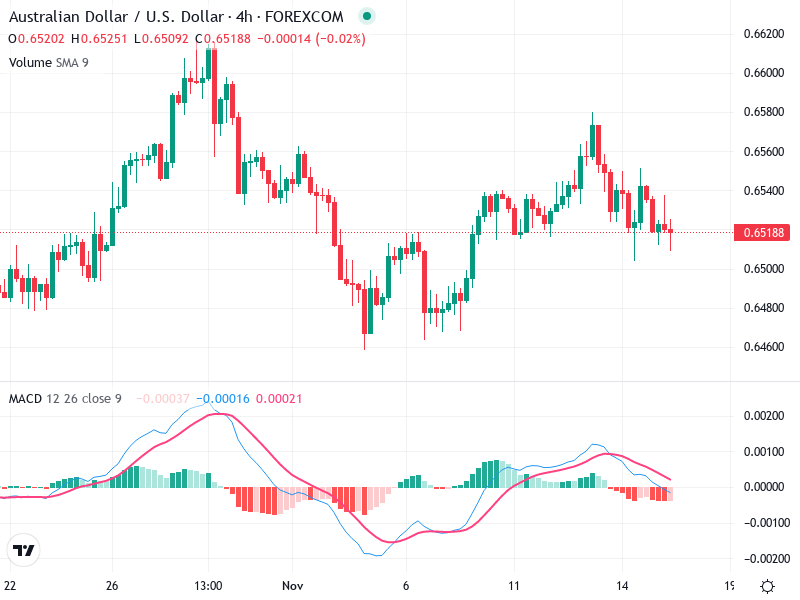
The chart exhibits a mix of candlestick patterns without a clear dominant pattern. Some small-bodied candles indicate indecision, potentially forming doji patterns.

Overall trend shows a sideways to slightly bullish direction, evidenced by upward movement from late October to early November followed by consolidation.

Breakout zones noted around 0.65600, with the 0.65000 level acting as possible pullback support.

MACD Analysis

The current MACD line sits below the Signal line, suggesting a bearish crossover and potential short-term downtrend.

The MACD histogram is flattening just below the zero line, indicating weakening bearish momentum.

No significant divergences between MACD and price action, confirming existing price trends.

Volume Analysis

Volume remains stable without significant spikes, supporting the ongoing consolidation trend.

No unusual volume spikes suggest institutional activity is absent, pointing to the likelihood of continued sideways trading.

Overall, volume analysis underscores a lack of strong buy/sell pressure.

Support & Resistance

Key Resistance: 0.65600, aligning with past highs.

Key Support: 0.65000, tested multiple times, establishing a strong support.

These levels are essential for determining breakout or pullback opportunities.

Actionable Insights

Buy Strategy: Look for buying opportunities on pullbacks near 0.65000, especially if bullish candlestick patterns and MACD upticks occur.

Sell Strategy: Consider shorting if there's a break below 0.65000 accompanied by rising volume.

Hold Strategy: Maintain a neutral position until the price moves beyond the current range.

The AI Technical Analysis Center is an informational tool only and does not constitute investment or trading advice.
This site is registered on wpml.org as a development site. Switch to a production site key to remove this banner.