Generic selectors
Exact matches only
Search in title
Search in content
Post Type Selectors

Popular stocks

Crypto

CFD

Currencies

Support

Gold

NSDQ – Technical Analysis – 4h

November 18, 2025 08:00

Quick Summary

The NASDAQ 100 Index chart indicates current consolidation with low volume, suggesting a prevailing caution among traders. Recent price movements have shown indecisiveness, accompanied by small-bodied candlesticks.

Despite these signs, the bearish momentum appears to be weakening as observed in the MACD changes.

Candlestick Analysis

There are no distinct candlestick patterns like bullish engulfing or doji visible currently. However, recent movement shows small-bodied candles, indicating indecision or consolidation.

The short-term trend seems slightly bearish as the price has been making lower highs and lower lows since peaking.

Around the 24,500 level, we see potential consolidation or support, as prices have recently bounced from here.

MACD Analysis

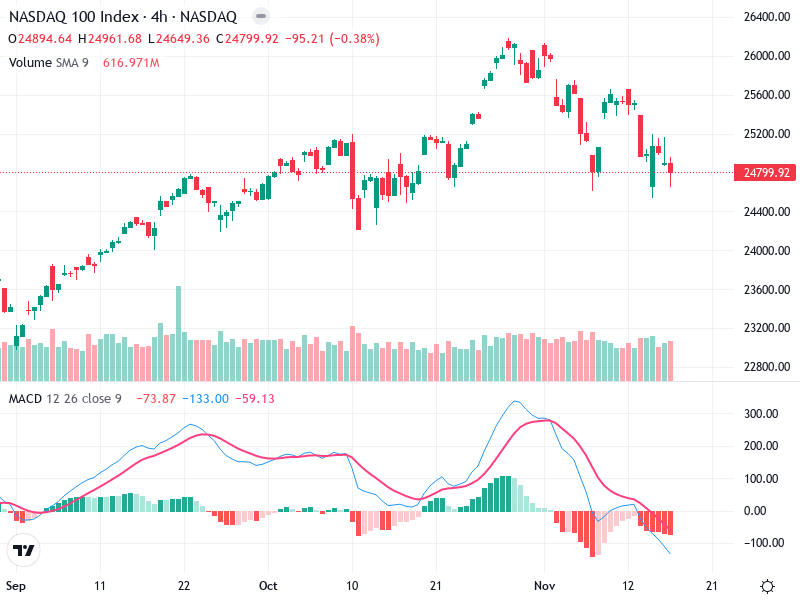
The MACD line is below the Signal line, indicating a bearish crossover that suggests potential downward momentum.

The histogram is negative, reflecting the current bearish momentum; however, it's showing signs of contraction, hinting at a potential reversal or weakening of the downtrend.

There's no clear divergence between the MACD and the price action, suggesting the recent price moves are consistent with the MACD readings.

Volume Analysis

The volume appears relatively stable with no significant spikes, suggesting a lack of strong buying or selling pressure recently.

The slight decrease in volume during recent downtrends may indicate that the sell-off is losing strength.

There are no notable unusual volume spikes that would suggest significant institutional activity.

Support & Resistance

Around 24,500, this area is acting as support based on recent price behavior.

Resistance seems to be appearing around the 25,500 level, where previous highs have failed to break.

These levels help identify potential entry and exit points depending on future price movements.

Actionable Insights

Consider a cautious approach; buying might be considered if there is a confirmed bounce above 24,500 with increasing volume. Selling could be strategic if the price declines further below this support.

Watch for a break above 25,500 with strong volume as a buy signal or a drop below 24,500 for additional selling pressure.

Confirmation from MACD turning bullish would strengthen the buying case.

The AI Technical Analysis Center is an informational tool only and does not constitute investment or trading advice.
This site is registered on wpml.org as a development site. Switch to a production site key to remove this banner.