Generic selectors
Exact matches only
Search in title
Search in content
Post Type Selectors

Popular stocks

Crypto

CFD

Currencies

Support

Gold

AUD/USD – Technical Analysis – 4h

November 19, 2025 13:02

Quick Summary

The 4-hour chart of AUD/USD indicates a pronounced downward trend.

The asset is currently testing critical support levels amid bearish signals.

Traders should consider key resistance and support insights for potential strategies.

Candlestick Analysis

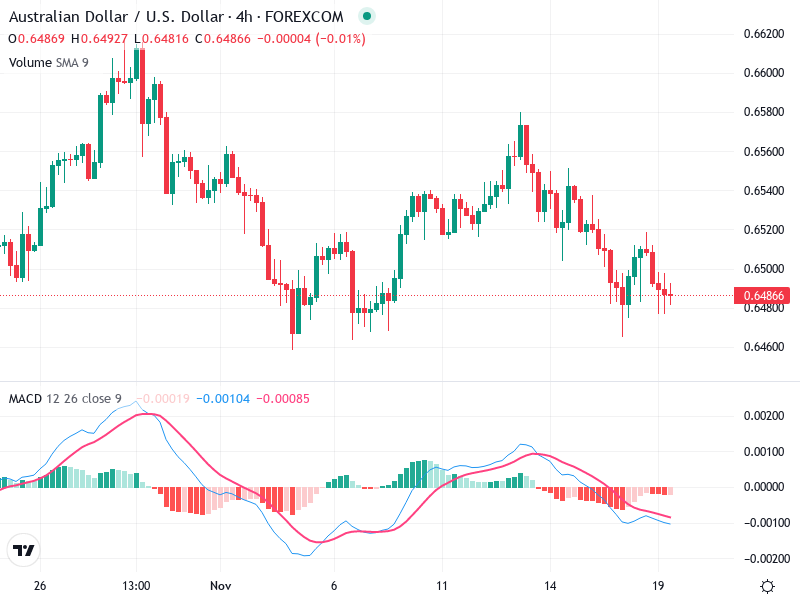
Recent candles show bearish tendencies with a series of red candles.

No distinct candlestick patterns such as a bullish engulfing or doji are evident in the immediate timeframe.

The current trend appears bearish, following lower highs and lower lows.

MACD Analysis

A recent bearish crossover is observed with the MACD line crossing below the Signal line.

This crossover suggests potential continued bearish momentum.

The histogram is currently negative, reinforcing bearish sentiment.

Volume Analysis

Volume appears relatively stable with no significant spikes.

There’s a slight increase in volume accompanying the recent price decline, which supports the bearish sentiment.

No unusual spikes suggesting institutional activity.

Support & Resistance

Key support level at 0.64800, where prices are currently testing.

Near-term resistance around 0.65200, which was a previous consolidation area.

Actionable Insights

Consider selling or holding if downward momentum continues and price closes below 0.64800.

Monitor for a break below this support level for confirmation of further downside.

Watch for a re-test of the 0.65200 resistance for any potential bullish reversal signals.

The AI Technical Analysis Center is an informational tool only and does not constitute investment or trading advice.
This site is registered on wpml.org as a development site. Switch to a production site key to remove this banner.