Generic selectors
Exact matches only
Search in title
Search in content
Post Type Selectors

Popular stocks

Crypto

CFD

Currencies

Support

Gold

OIL – Technical Analysis – 4h

November 19, 2025 17:01

Quick Summary

The chart presents the technical analysis of Crude Oil Futures on a 4-hour timeframe. The price action demonstrates a consolidation phase with periodic volatility. Traders should remain vigilant to the support and resistance levels highlighted.

Candlestick Analysis

There appears to be a large bearish candlestick followed by a smaller bullish candle towards the right of the chart, suggesting a potential bullish reversal pattern.

The trend seems mostly sideways with periods of volatile price swings, indicating consolidation.

Noticeable pullback around the $58.50 level, where the price rebounded after a dip.

MACD Analysis

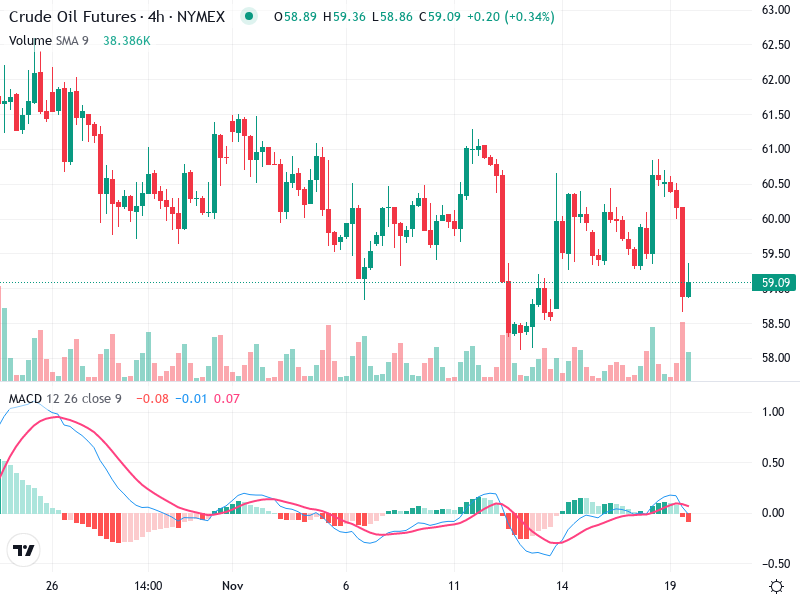
The MACD line has crossed below the signal line recently, indicating a bearish crossover, which suggests a potential downtrend.

The histogram shows declining momentum, though starting to converge, which could suggest weakening bearish momentum.

No clear divergences are evident between MACD and price action currently.

Volume Analysis

There's an increase in volume during the price dip towards $58.50, potentially indicating strong buying interest at lower levels.

The spike in volume supports the subsequent price rebound, suggesting buying pressure.

The sharp volume increase aligns with major price actions, indicative of potential institutional involvement.

Support & Resistance

Around $58.50 is a critical support level where buying interest re-emerges.

Near $60.50, where previous upward moves have stalled, marking it as an important zone to watch.

A close watch on these levels could provide key trading opportunities.

Actionable Insights

Consider entering long positions near the $58.50 support with a stop loss slightly below; watch for bullish candlestick confirmation.

Monitor for bearish pressure near resistance levels around $60.50 to initiate short positions if price fails to break through.

During indecisive or sideways movement, holding may be advisable until clearer signals emerge.

The AI Technical Analysis Center is an informational tool only and does not constitute investment or trading advice.
This site is registered on wpml.org as a development site. Switch to a production site key to remove this banner.