Generic selectors
Exact matches only
Search in title
Search in content
Post Type Selectors

Popular stocks

Crypto

CFD

Currencies

Support

Gold

OIL – Technical Analysis – 4h

November 20, 2025 17:01

Quick Summary

This technical analysis focuses on the asset’s chart patterns and indicators.

The analysis identifies key levels, patterns, and potential market movements.

Based on the given insights, the asset’s current trend and actionable strategies are outlined.

Candlestick Analysis

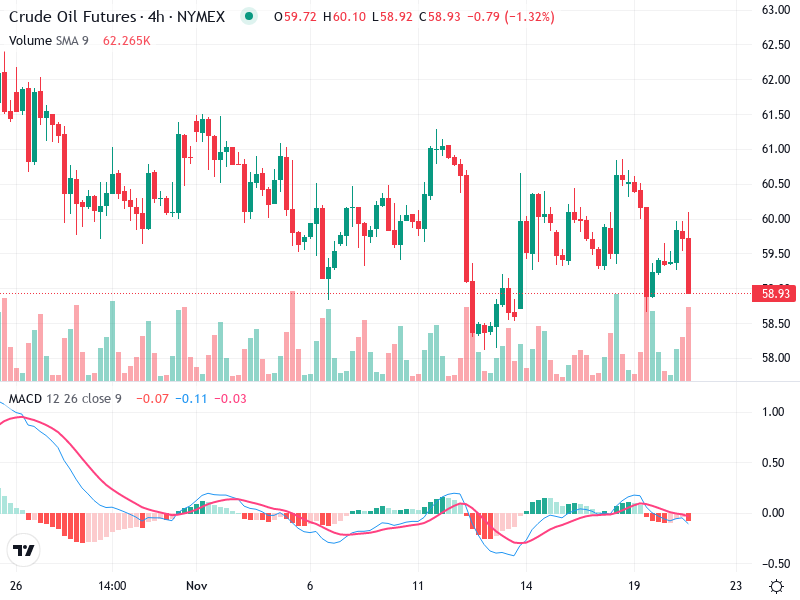
The chart shows several indecisive candlestick patterns, such as doji, indicating uncertainty in the market.

A recent large red candlestick suggests selling pressure, possibly indicating a minor bearish trend.

The trend appears to be sideways with a slight bearish bias, as evidenced by multiple failed attempts to maintain higher levels.

MACD Analysis

The MACD is hovering close to the zero line with the MACD line slightly below the Signal line, suggesting weak bearish momentum.

The histogram is slightly negative, indicating a continuation of bearish momentum but not strongly so.

No significant divergences are observed between MACD and price action, consistent with the current sideways trend.

Volume Analysis

Volume spikes are visible in areas where large candlesticks formed, suggesting higher interest and potentially institutional activity during these periods.

The higher volume on downward moves suggests confirmation of selling pressure during those times.

Observe the volume spikes correlating with the large red candlesticks, indicating stronger selling interest.

Support & Resistance

Immediate support is around $58.50. A break below this could suggest further downside risk.

Established resistance around $60.50. Successful breaching of this level is necessary for a bullish reversal.

Actionable Insights

**Sell**: If the price breaks below the $58.50 level with volume support, consider short positions.

**Hold**: For existing positions, unless there's a strong breakout above $60.50 or below $58.50.

Keep an eye out for confirmation signals such as a bullish MACD crossover for potential reversals.

The AI Technical Analysis Center is an informational tool only and does not constitute investment or trading advice.
This site is registered on wpml.org as a development site. Switch to a production site key to remove this banner.