Generic selectors
Exact matches only
Search in title
Search in content
Post Type Selectors

Popular stocks

Crypto

CFD

Currencies

Support

Gold

GOLD – Technical Analysis – 4h

November 20, 2025 17:03

Quick Summary

gold Futures have displayed a predominantly sideways to bearish trend on the 4-hour chart. The asset’s pricing remains constrained without clear upward momentum following a previous decline.

Sellers seem to hold control, and crucial breakout zones are being tested, signaling possible volatility in the near term.

Candlestick Analysis

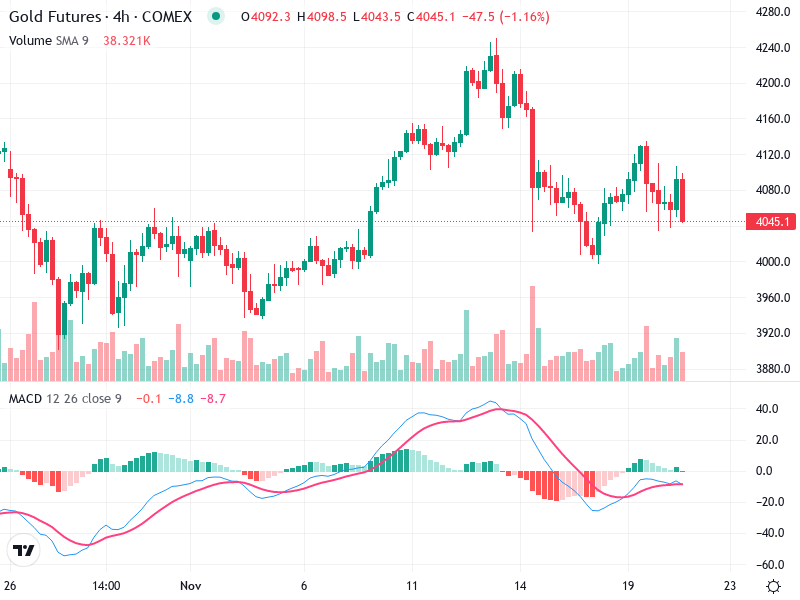
The overall trend indicated by the candlestick patterns is currently sideways to bearish, as the price has failed to establish a clear upward momentum post the recent decline from the high around 4220.

No distinct major patterns like bullish engulfing or hammer, noticeable smaller red candlesticks suggest selling pressure.

A key breakout zone was around 4120, where the price failed to sustain, leading to a pullback.

MACD Analysis

The MACD line is below the Signal line, indicating a bearish crossover, which suggests potential continued downward pressure.

The MACD histogram is near zero, showing reduced bearish momentum. However, the absence of a positive transition suggests caution for bulls.

No clear divergence between MACD and the price action is evident.

Volume Analysis

Noticeable volume spikes accompany price declines, supporting the bearish sentiment. The volume has been inconsistent during upward moves.

The spikes in volume during price decreases could indicate potential institutional selling.

Volume patterns suggest a lack of buyer confidence during upward movements.

Support & Resistance

Near-term support is around 4040. If broken, the next key level would be around 4000.

Resistance is apparent at approximately 4120. A breakout above this could signal a reversal in the trend.

Traders should watch the 4040 support and 4120 resistance for potential breakouts.

Actionable Insights

Consider long positions if the price breaks above the 4120 resistance with strong volume, which would suggest a reversal.

Short positions could be considered if the price continues to reject the 4120 level or breaks the 4040 support with high volume.

Holding might be advisable if the price continues to fluctuate between 4040 and 4120 without significant volume supporting either direction.

The AI Technical Analysis Center is an informational tool only and does not constitute investment or trading advice.
This site is registered on wpml.org as a development site. Switch to a production site key to remove this banner.