Generic selectors
Exact matches only
Search in title
Search in content
Post Type Selectors

Popular stocks

Crypto

CFD

Currencies

Support

Gold

NSDQ – Technical Analysis – 4h

November 21, 2025 08:00

Quick Summary

The NASDAQ 100 Index chart reveals significant insights into its current state.

The index is experiencing strong bearish momentum reflected in the technical indicators.

Candlestick Analysis

The recent candles show a strong bearish momentum with a large red candle, suggesting a continuation of the current downtrend.

A potential hammer pattern appears at the lowest point, indicating a possible reversal or pause in the downtrend.

The overall trend is bearish with lower highs and lower lows forming, indicating continued downward pressure.

MACD Analysis

The MACD line is below the Signal line, confirming a bearish crossover. This indicates persistent bearish momentum.

The declining histogram bars below the zero line support the ongoing bearish momentum. However, watch for a potential slowdown or reversal if the histogram starts contracting.

There is no significant divergence at the moment; MACD movements and price action are aligned in direction.

Volume Analysis

Increased volume accompanies the recent downward movement, which affirms the strength of the bearish trend.

The volume spike during bearish candles suggests strong selling pressure, potentially indicating institutional selling activity.

The increased volume is a warning signal of heightened market activity and potential further volatility.

Support & Resistance

The next potential support level is around 24,000, which is a psychological level that could provide some buying interest.

Resistance is anticipated around the 24,800 level, marking recent pivot highs where selling could reemerge.

Actionable Insights

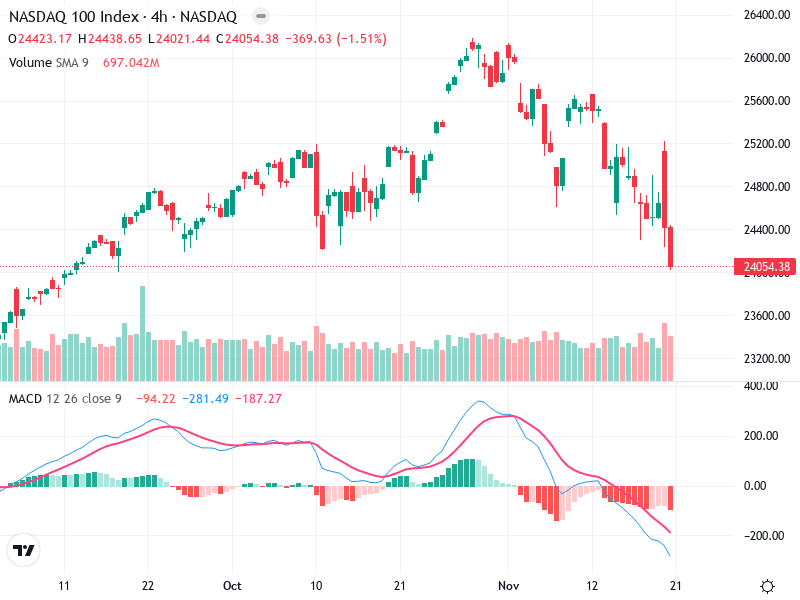
Traders could consider short positions, given the bearish trend, with stops just above recent resistance levels.

Those considering long positions might wait for confirmation of a reversal candlestick pattern or a bullish crossover on MACD.

Watch for price action around the 24,000 support level and any changes in volume profile to assess buying interest.

The AI Technical Analysis Center is an informational tool only and does not constitute investment or trading advice.
This site is registered on wpml.org as a development site. Switch to a production site key to remove this banner.