Generic selectors
Exact matches only
Search in title
Search in content
Post Type Selectors

Popular stocks

Crypto

CFD

Currencies

Support

Gold

OIL – Technical Analysis – 4h

November 21, 2025 17:01

Quick Summary

The chart indicates a period of bearish pressure with sideways movements interspersed by downward trends. Current analysis shows important support levels essential for future price direction. Understanding these levels is crucial for making informed trading decisions on .

Candlestick Analysis

The overall trend on this 4-hour chart has been sideways to slightly bearish, marked by periods of consolidation followed by downward movements.

No clear single-pattern formations such as bullish engulfing or hammers are present, but multiple downward red candles recently indicate bearish pressure.

The price recently reached a low around the 57.50 mark, suggesting a potential pullback zone if the price reverses.

MACD Analysis

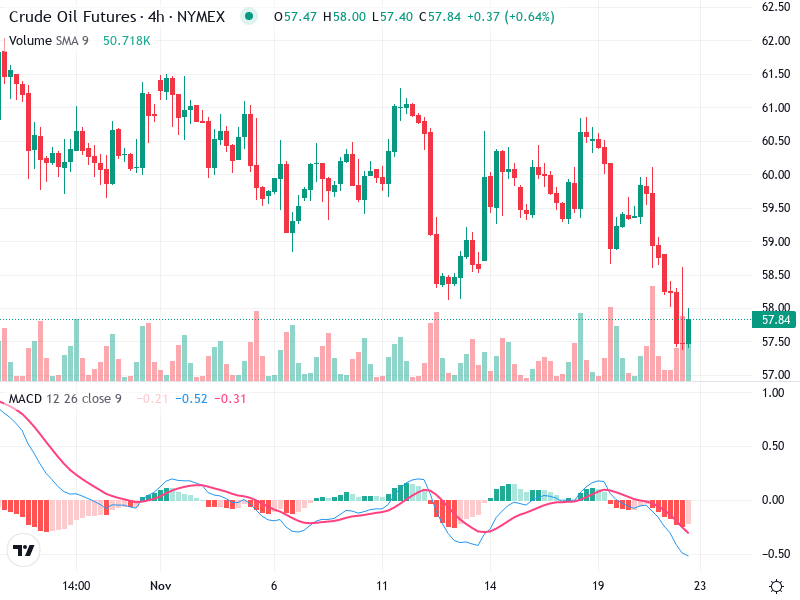
The MACD line is below the Signal line, indicating a bearish crossover, which suggests rising bearish momentum.

The histogram is negative and increasing in depth, reinforcing the bearish momentum.

There appears to be no strong divergence with price action, suggesting the MACD is in line with current price movements.

Volume Analysis

There are occasional spikes in volume which coincide with strong bearish candles, suggesting selling pressure possibly supported by institutional activity.

The increased volume during price drops supports the bearish sentiment.

The current sentiment appears bearish with cautious consolidation at support levels.

Support & Resistance

The 57.50 level appears to act as a key support zone. A break below this level with volume may indicate further downside potential.

A near-term resistance is around the 59.50 to 60.00 range, where previous upwards attempts have been rejected.

If the price breaks below the 57.50 support with high volume, there is a likely continued downside.

Actionable Insights

Consider waiting for a confirmed reversal pattern or bullish signals in candlesticks or MACD to emerge, especially around the support level.

If the price breaks below the 57.50 support with high volume, consider short positions as there would be likely continued downside.

If already holding, closely monitor for any signs of reversal or a breakdown below support to adjust positions accordingly.

The AI Technical Analysis Center is an informational tool only and does not constitute investment or trading advice.
This site is registered on wpml.org as a development site.