Generic selectors
Exact matches only
Search in title
Search in content
Post Type Selectors

Popular stocks

Crypto

CFD

Currencies

Support

Gold

AUD/USD – Technical Analysis – 4h

November 24, 2025 13:02

Quick Summary

The chart showcases with current technical indicators highlighting mixed signals.

Overall sentiment reflects cautious optimism with potential for upward momentum, yet overall uncertainty persists.

The asset is currently experiencing a sideways trend with brief bullish retracements.

Candlestick Analysis

A recent bullish engulfing pattern is observed near the current price, suggesting potential upward momentum.

The presence of doji candlesticks added uncertainty and indecision in recent sessions.

A recent pullback seems to have occurred around the 0.6480 level, with a breakout potential seen above 0.6500.

MACD Analysis

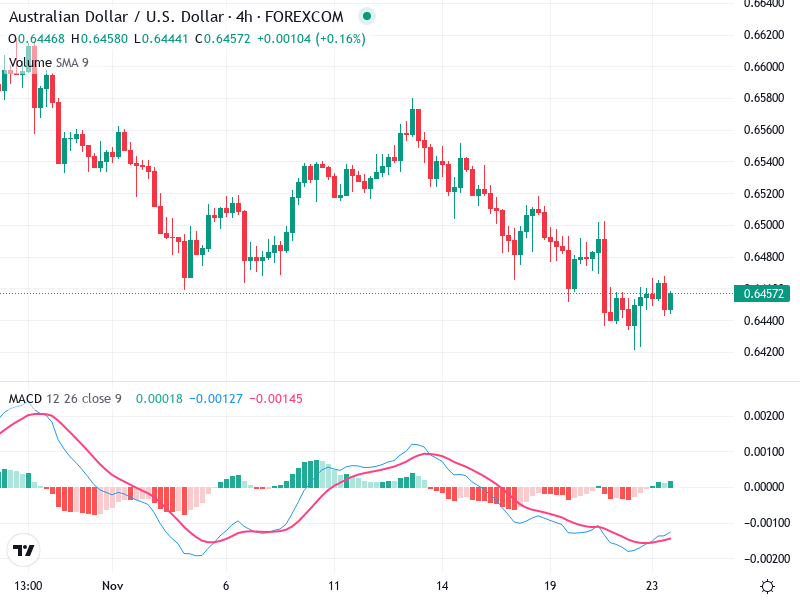
The MACD line is near a bearish crossover with the Signal line, suggesting a potential downturn. However, it has not decisively crossed over yet.

The histogram shows decreasing bearish momentum, possibly indicating a decrease in selling pressure.

No significant divergences noted between MACD and price action, but close monitoring is advised for any upcoming changes.

Volume Analysis

There are no significant volume spikes to suggest strong buying or selling pressure. Volume is moderate and consistent with the sideways trend.

The moderate volume levels suggest that recent price movements lack strong conviction.

No unusual spikes indicating institutional activity.

Support & Resistance

Strong support is identified around the 0.6440 level, where price has previously rebounded.

Immediate resistance is at 0.6480, with a more significant resistance around 0.6520.

The chart also suggests watching for a breakout or breakdown to determine future direction.

Actionable Insights

Buy Strategy: Enter long if bullish signals appear with a clear break above 0.6500, supported by increased volume.

Sell Strategy: Consider short positions if the price falls below 0.6440 decisively with increasing volume.

Watch for confirmation of the MACD crossover for better timing and observe for volume increase to validate any breakout above resistance or below support levels.

The AI Technical Analysis Center is an informational tool only and does not constitute investment or trading advice.
This site is registered on wpml.org as a development site. Switch to a production site key to remove this banner.