Generic selectors
Exact matches only
Search in title
Search in content
Post Type Selectors

Popular stocks

Crypto

CFD

Currencies

Support

Gold

GOLD – Technical Analysis – 4h

November 25, 2025 17:02

Quick Summary

The chart provides a comprehensive technical analysis of the asset’s performance over recent weeks. It highlights significant candlestick patterns, alongside a detailed evaluation of the MACD and volume trends. Key levels of support and resistance are identified, providing insights into potential market movements.

Analyzing the overall market sentiment reveals indications of either a bullish continuation or a possible neutral consolidation, depending on upcoming market developments.

Candlestick Analysis

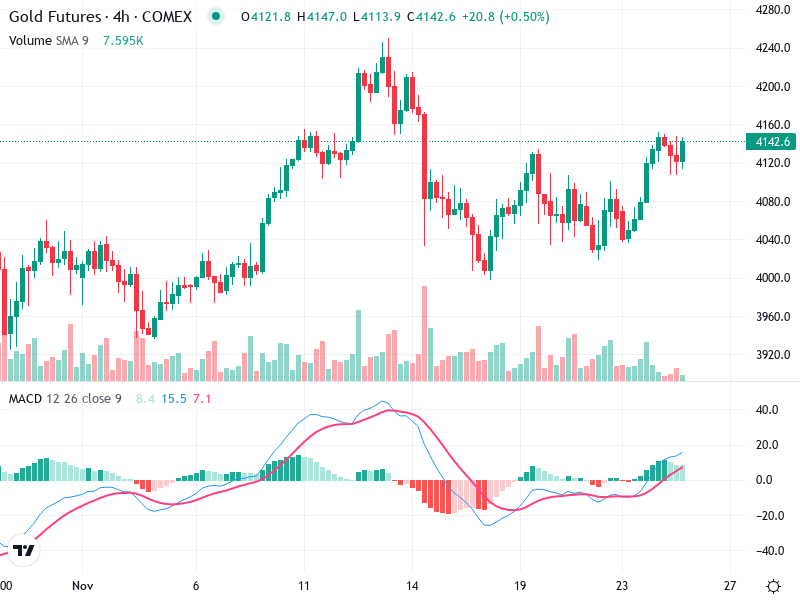
The chart shows a few significant patterns, such as possible bullish engulfing patterns around Nov 15, indicating potential bullish reversals.

There are also small-bodied candles indicating indecision, possibly doji.

Initially bullish, followed by a sharp bearish reversal with a potential recovery currently, but overall appears sideways in the short term.

MACD Analysis

Presently, the MACD line is above the Signal line, suggesting a bullish crossover recently occurred.

Increasing green bars on the histogram indicate growing bullish momentum.

No significant divergence observed between MACD and price action, indicating current momentum aligns with price movement.

Volume Analysis

Noteworthy volume spikes around the beginning of November and mid-month, potentially indicating institutional activity during those periods.

Recent volume upticks coincide with price rallies, supporting upward movements in price.

Volume shows less intensity in the latest recovery attempt, suggesting cautious bullish sentiment.

Support & Resistance

Around 4080, this level has been tested multiple times and held, suggesting strong buying interest.

Near 4160, this level is currently acting as a potential barrier to further gains.

A breakout above this could signal continuation of bullish sentiment.

Actionable Insights

Consider buying if price breaks above the 4160 resistance with strong volume confirmation.

Cautious sell or reduce positions if it fails to hold the 4080 support.

Look for a confirmation breakout above resistance with accompanying high volume for a stronger bullish view, or caution if approaching with declining volume.

The AI Technical Analysis Center is an informational tool only and does not constitute investment or trading advice.
This site is registered on wpml.org as a development site. Switch to a production site key to remove this banner.