Generic selectors
Exact matches only
Search in title
Search in content
Post Type Selectors

Popular stocks

Crypto

CFD

Currencies

Support

Gold

NSDQ – Technical Analysis – 4h

November 26, 2025 08:00

Quick Summary

The NASDAQ 100 index chart shows signs of a recovery as it transitions from a recent downtrend. Bullish momentum is building, indicated by higher highs and higher lows.

This technical analysis highlights key patterns, momentum indicators, and actionable insights based on current market behavior.

Candlestick Analysis

The overall trend shows a recovery from a recent downtrend, transitioning into a bullish trend with higher highs and higher lows forming.

A bullish reversal pattern appears around the recent lows, characterized by a series of bullish candlesticks. This suggests a potential bottom has formed.

Recently, the chart shows a series of bullish candlesticks indicating momentum building upwards.

MACD Analysis

The MACD line has crossed above the Signal line, indicating a bullish crossover. This suggests building positive momentum.

The histogram shows increasing bars above the zero line, confirming the bullish trend.

No clear divergence is noted currently between the MACD and price action, indicating alignment in momentum and price movement.

Volume Analysis

There is a noticeable increase in volume accompanying the recent upward move, which supports the bullish momentum.

The spike in volume during the recent recovery could suggest institutional buying interest supporting the rally.

This increased volume strengthens the bullish sentiment, indicating a supportive market environment.

Support & Resistance

Significant support lies around the 24,500 area, where the price found a bottom recently.

The 25,250 area is a critical resistance level, aligning with historical highs in this timeframe.

A break above this resistance could further validate the bullish trend.

Actionable Insights

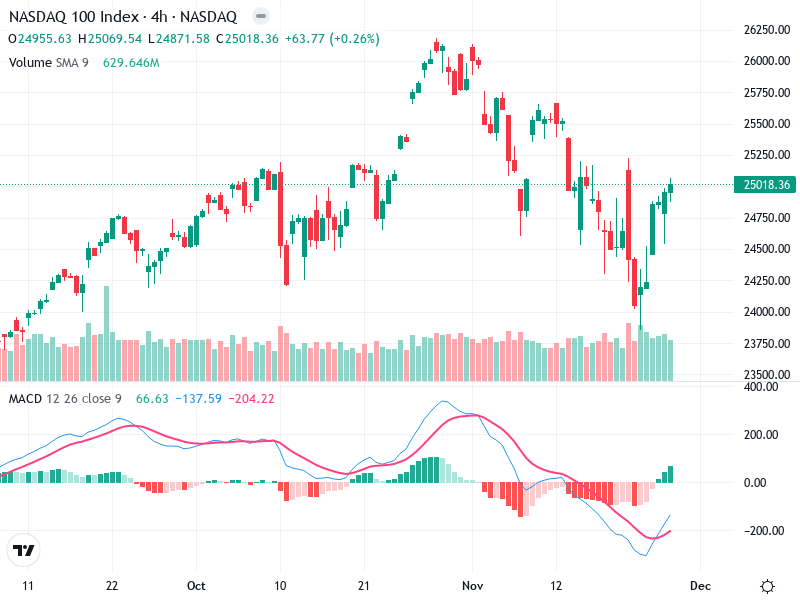
Consider buying opportunities on pullbacks to the support area around 24,750 if the bullish momentum continues. Watch for confirmations like bullish candlestick patterns or increased volume.

Be cautious around the 25,250 resistance. A failure to break this level with volume might present a short-term selling opportunity.

Long-term holders may want to maintain positions while the trend remains bullish, but monitoring near-term resistance for any reversals is advised.

The AI Technical Analysis Center is an informational tool only and does not constitute investment or trading advice.
This site is registered on wpml.org as a development site. Switch to a production site key to remove this banner.