Generic selectors
Exact matches only
Search in title
Search in content
Post Type Selectors

Popular stocks

Crypto

CFD

Currencies

Support

Gold

EUR/USD – Technical Analysis – 4h

November 26, 2025 08:02

Quick Summary

The chart presents the asset moving in a bullish direction with recent higher lows and higher highs.

The presence of a bullish engulfing pattern suggests further upward movement.

Candlestick Analysis

The chart shows a reversal from a recent downtrend to a bullish trend as seen by the recent higher lows and higher highs.

There is a possible bullish engulfing pattern around November 19, signaling potential reversal, which seems confirmed by subsequent upward movement.

The presence of several smaller green candles indicates steady upward momentum.

MACD Analysis

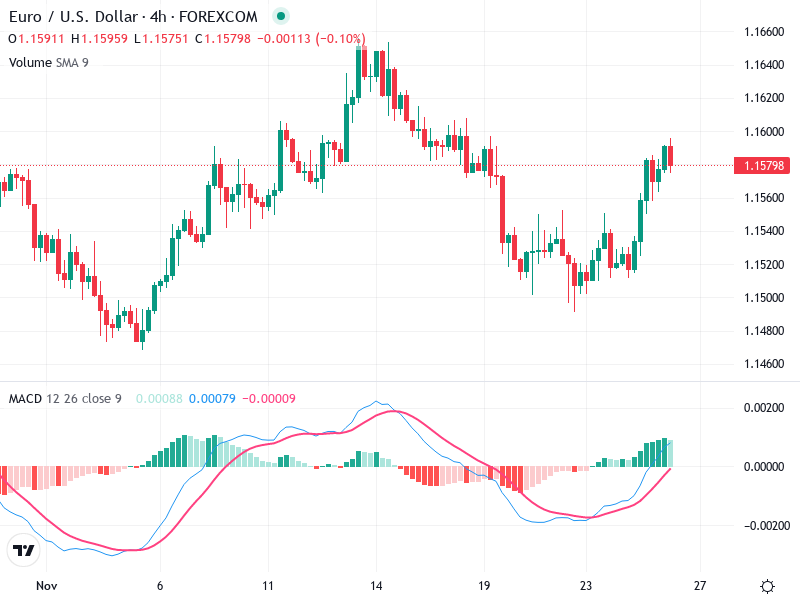
The MACD line (blue) is above the Signal line (red), indicating bullish momentum. A recent bullish crossover supports the upward trend.

The histogram is positive and increasing, suggesting strengthening bullish momentum.

No significant divergences observed between MACD and price action, affirming current trend direction.

Volume Analysis

Volume has increased slightly during the recent upward trend, supporting the price increase.

There are no significant volume spikes, suggesting the current move may not involve significant institutional activity.

Traders should monitor for any volume changes to gauge market sentiment.

Support & Resistance

Key Resistance: Around the 1.1600 level, just reached by recent price action, which may act as resistance.

Key Support: Seen around the 1.1500 level, where price has previously bounced.

Observation of these levels is crucial for potential breakouts or pullbacks.

Actionable Insights

Consider a hold or cautious buy strategy given the current bullish sentiment. If the price breaks above 1.1600 with increasing volume, it could signal a stronger move upward.

Monitor for any reversal patterns or decreasing momentum above 1.1600 that could indicate a pullback.

A close above the 1.1600 resistance level on strong volume would confirm continued bullish momentum.

The AI Technical Analysis Center is an informational tool only and does not constitute investment or trading advice.
This site is registered on wpml.org as a development site. Switch to a production site key to remove this banner.