Generic selectors
Exact matches only
Search in title
Search in content
Post Type Selectors

Popular stocks

Crypto

CFD

Currencies

Support

Gold

AUD/USD – Technical Analysis – 4h

November 26, 2025 13:02

Quick Summary

The AUD/USD chart is displaying clear movements indicative of market dynamics.

Recent trends suggest potential bullish momentum after a period of broader downtrend.

The current price action is testing significant levels, offering traders key insights.

Candlestick Analysis

The overall trend in the chart shows a recent bullish movement following a period of downtrend.

There is a bullish reversal pattern evident in the form of a series of green candles after the recent low near 0.6420.

A potential bullish engulfing pattern can be seen near the recent upward move, indicating buying strength.

MACD Analysis

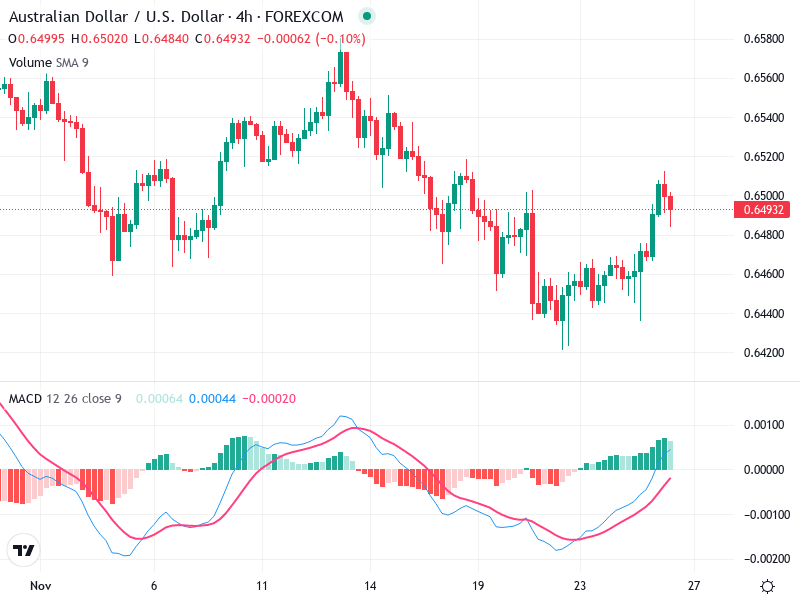
The MACD line has crossed above the Signal line, indicating a bullish crossover, which suggests upward momentum could continue.

Positive bars on the histogram reinforce the bullish sentiment, and the increasing size of bars shows strengthening momentum.

No significant divergences are present currently between MACD and the price action.

Volume Analysis

There is an increase in volume accompanying the recent upward price movement, which supports the bullish breakout attempt.

A notable increase in volume was seen in the recent bullish candles, suggesting potential institutional interest.

Continued volume analysis will be crucial in understanding future movements.

Support & Resistance

Key support is around 0.6420, where the price found recent buying interest.

A critical resistance level is around 0.6500, observed from the recent price rejection.

Watching these levels can provide insights into future price action.

Actionable Insights

Consider entering a long position if the price can decisively break above the 0.6500 resistance with strong volume confirmation.

Monitor for any bearish reversal patterns near the resistance at 0.6500; a failure to break this level could lead to a pullback to support.

If currently holding a position, consider setting a stop loss just below 0.6420 to protect against a downtrend reversal.

The AI Technical Analysis Center is an informational tool only and does not constitute investment or trading advice.
This site is registered on wpml.org as a development site. Switch to a production site key to remove this banner.