Generic selectors
Exact matches only
Search in title
Search in content
Post Type Selectors

Popular stocks

Crypto

CFD

Currencies

Support

Gold

GOLD – Technical Analysis – 4h

November 26, 2025 17:02

Quick Summary

The chart of gold Futures illustrates a transition from a bearish to a bullish phase, signaling an optimistic outlook. Recent higher lows and highs indicate a bullish trend in the short term, with key levels poised for potential breakout or pullback actions. Analyzing volume and MACD supports this trend direction.

Candlestick Analysis

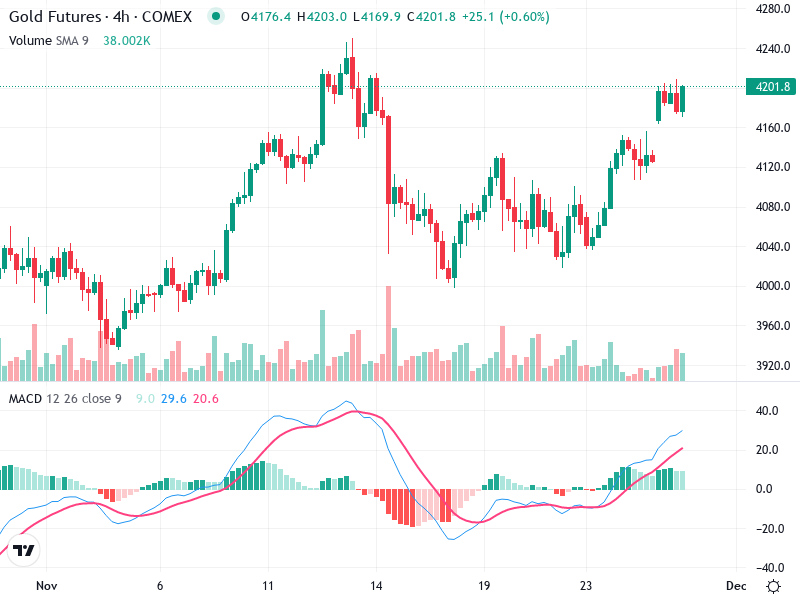
The chart shows a recent transition from a bearish phase to a bullish phase, indicating a short-term bullish trend characterized by higher lows and higher highs.

A potential bullish engulfing pattern suggests a continuation of the upward trend, despite current consolidation phases indicating a pause before the next move.

The potential for a breakout above 4205, with a pullback to the 4160-4180 zone acting as consolidation support, is notable.

MACD Analysis

The MACD line is above the Signal line, indicating a bullish crossover that suggests current bullish momentum.

The positive and expanding MACD histogram supports the upward momentum and suggests strengthening market sentiment.

There are no significant divergences noted, as both MACD and price action align closely.

Volume Analysis

Volume has increased during recent upward movements, supporting the price action and the bullish trend direction.

The correlation between volume and price movements suggests higher trading activity backing the bullish trend.

A noticeable spike in volume coincided with the bullish engulfing pattern, indicating potential institutional activity reinforcing the bullish phase.

Support & Resistance

The area around 4205 is a short-term resistance, with potential for a breakout upon sustained momentum.

The 4160-4180 range is identified as a critical support zone that previously acted as resistance, promising a solid foundation during a pullback.

If the price finds support in these zones, it could influence future price movements significantly.

Actionable Insights

Consider buying if the price breaks above the 4205 resistance with strong volume, indicating continued bullish momentum.

Look to take profits if resistance proves formidable or bearish patterns begin to emerge.

If currently holding, monitor the progression closely for a breakout above resistance supported by volume and MACD signals for confirmation.

The AI Technical Analysis Center is an informational tool only and does not constitute investment or trading advice.
This site is registered on wpml.org as a development site. Switch to a production site key to remove this banner.