Generic selectors
Exact matches only
Search in title
Search in content
Post Type Selectors

Popular stocks

Crypto

CFD

Currencies

Support

Gold

NSDQ – Technical Analysis – 4h

November 27, 2025 08:00

Quick Summary

The analysis of the chart highlights an emerging bullish trend. Recent price actions suggest a recovery from previous declines.

Indications of strong momentum are present, driven by technical patterns and various indicators.

Candlestick Analysis

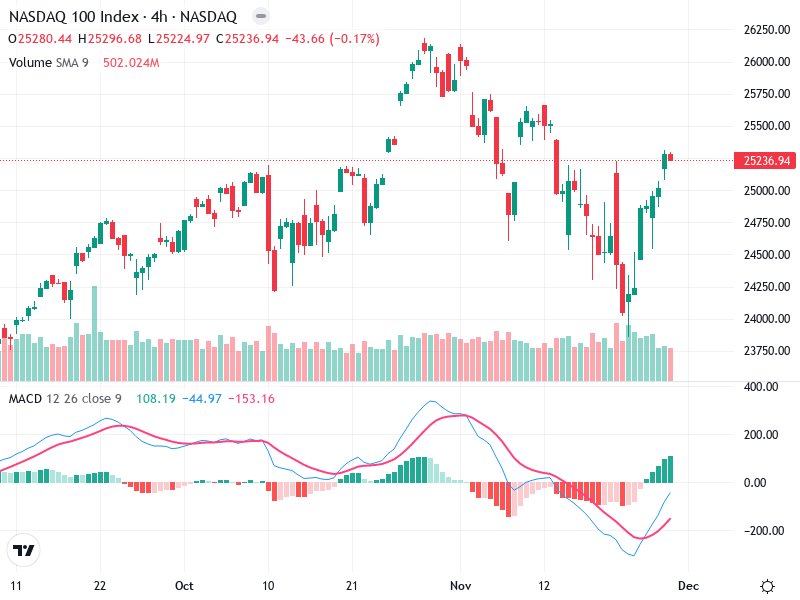
Recent bullish candlestick patterns suggest bullish sentiment, particularly after the downtrend, with a possible hammer followed by several bullish candles indicating reversal potential.

The chart shows a transition from a bearish to a bullish trend as recent price action moves upwards after a sharp decline.

A potential breakout zone is around 25,300, which aligns with recent highs. A pullback might occur if it fails to sustain above this level.

MACD Analysis

The MACD line is above the Signal line, suggesting a bullish crossover, reinforcing positive momentum.

Histogram bars are increasing, indicating growing bullish momentum.

No apparent divergences currently; MACD movement aligns well with the price action.

Volume Analysis

An increase in volume accompanies recent upward price action, supporting the bullish trend.

Rising volume during price increase suggests strong buying interest.

Some volume spikes suggest possible institutional interest or significant market activity.

Support & Resistance

Support: Around 24,500 where previous price consolidation and rebounds occurred.

Resistance: Near 25,600 where the price previously failed to sustain and reversed.

These levels are crucial for assessing potential reversals or confirmation of trend continuation.

Actionable Insights

Consider buying if the price breaks and sustains above the resistance at 25,600 with supporting volume and MACD trends.

Watch for reversal signals or bearish patterns near resistance for potential short opportunities.

If holding positions, monitor for sustained momentum or signs of weakening at key levels.

The AI Technical Analysis Center is an informational tool only and does not constitute investment or trading advice.
This site is registered on wpml.org as a development site. Switch to a production site key to remove this banner.