Generic selectors
Exact matches only
Search in title
Search in content
Post Type Selectors

Popular stocks

Crypto

CFD

Currencies

Support

Gold

NZD/USD – Technical Analysis – 4h

November 27, 2025 13:00

Quick Summary

The asset’s chart exhibits recent bullish tendencies following a previous downturn and consolidation phase. The candlestick patterns signify bullish momentum with a noticeable breakout.

This breakout is confirmed around the 0.5700-0.5720 level, hinting at a possible bullish continuation.

Candlestick Analysis

The chart shows a recent bullish trend after a period of decline and sideways movement.

There are signs of bullish momentum, with a recent breakout to the upside.

The area around 0.57000.5720 appears to be a breakout region, confirming a bullish continuation.

MACD Analysis

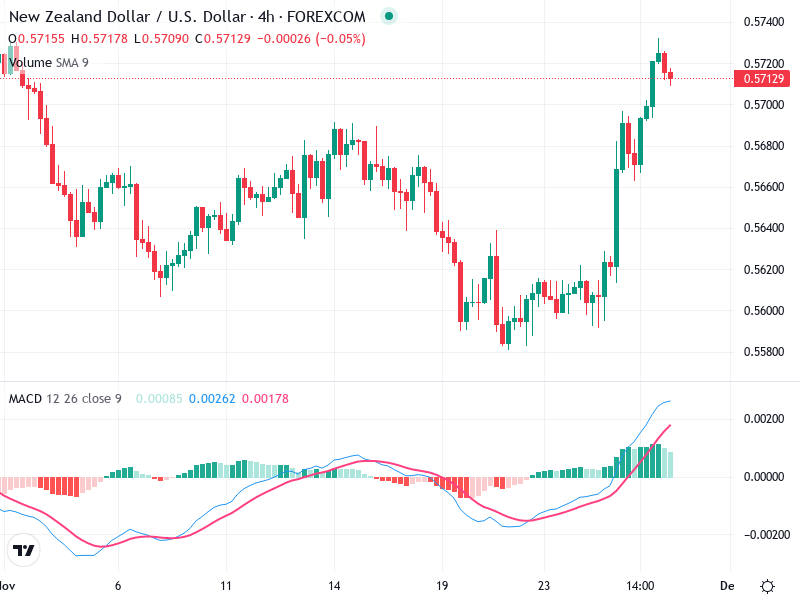
The MACD line has crossed above the Signal line, which is a bullish crossover indicating positive momentum.

The histogram is increasing, reflecting strengthening bullish momentum.

There is no apparent divergence between the MACD and price action, supporting current price movements.

Volume Analysis

There is a noticeable increase in volume corresponding with the recent price rise, suggesting strong bullish interest.

The increase in volume may imply institutional buying.

Volume supports the recent upward breakout, reinforcing the bullish sentiment.

Support & Resistance

The area around 0.5720 acts as a current resistance level; a breakout above it can confirm further bullishness.

The area around 0.5620 seems to serve as a recent support level, crucial for maintaining the upward momentum.

A break with volume could signal further upside.

Actionable Insights

Consider a buy strategy on any pullbacks to the 0.5700 region if confirmed by sustained volume and bullish candlestick patterns.

Monitor for any reversal patterns near the resistance for potential pullbacks.

Look for additional bullish signals, such as a continuation in volume increase and MACD strength, for a more extended bullish play.

The AI Technical Analysis Center is an informational tool only and does not constitute investment or trading advice.
This site is registered on wpml.org as a development site. Switch to a production site key to remove this banner.