Generic selectors
Exact matches only
Search in title
Search in content
Post Type Selectors

Popular stocks

Crypto

CFD

Currencies

Support

Gold

OIL – Technical Analysis – 4h

November 27, 2025 17:00

Quick Summary

The chart is showing intriguing movements.

Traders are observing recent patterns which could indicate future directions.

Candlestick Analysis

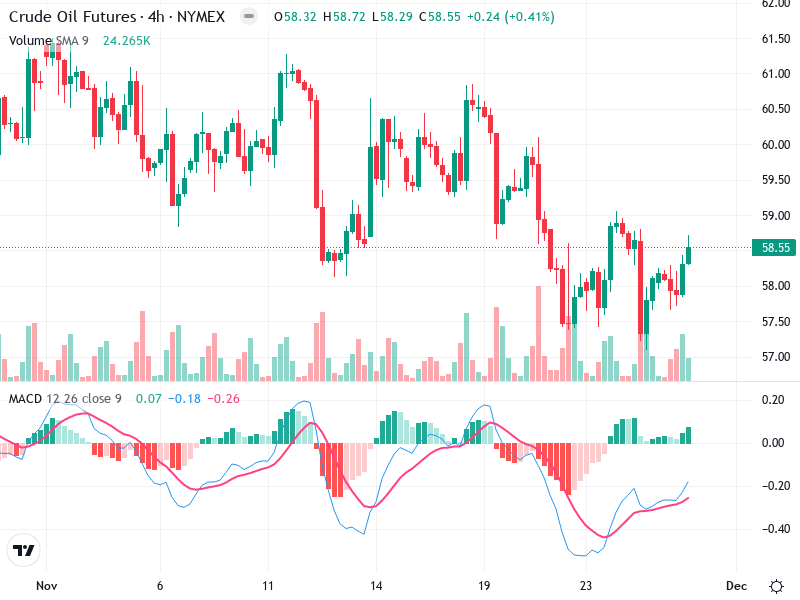
The chart shows a sideways trend with recent bullish momentum.

A potential bullish engulfing pattern is visible towards the end of the chart, indicating a possible reversal to the upside.

Resistance is observed around the 59.50 level, with a recent breakout attempt past a minor resistance level.

MACD Analysis

The MACD line has crossed above the Signal line, indicating a bullish crossover.

The MACD histogram is positive and expanding, suggesting increasing bullish momentum.

No clear MACD divergence observed with price action.

Volume Analysis

There is a noticeable increase in volume accompanying the recent bullish move, confirming the upward momentum.

Volume spikes near support suggest possible institutional buying interest.

Support & Resistance

Key support is around 57.50, showing historical buying interest.

Key resistance is approaching 59.50; a break above this could signal further upside potential.

Actionable Insights

Consider a buy strategy if the price sustains above the immediate resistance of 59.50 with continued volume support.

Watch for confirmation of bullish momentum with continued higher highs and higher lows, keeping an eye on volume to support the move.

Monitor for potential reversal signals if the price struggles to maintain above 59.

The AI Technical Analysis Center is an informational tool only and does not constitute investment or trading advice.
This site is registered on wpml.org as a development site. Switch to a production site key to remove this banner.