Generic selectors
Exact matches only
Search in title
Search in content
Post Type Selectors

Popular stocks

Crypto

CFD

Currencies

Support

Gold

NSDQ – Technical Analysis – 4h

November 28, 2025 08:00

Quick Summary

The NASDAQ 100 chart shows a recovery from its recent downtrend.

Key indicators suggest a potential bullish breakout, contingent on volume confirmation and resistance levels being surpassed.

Candlestick Analysis

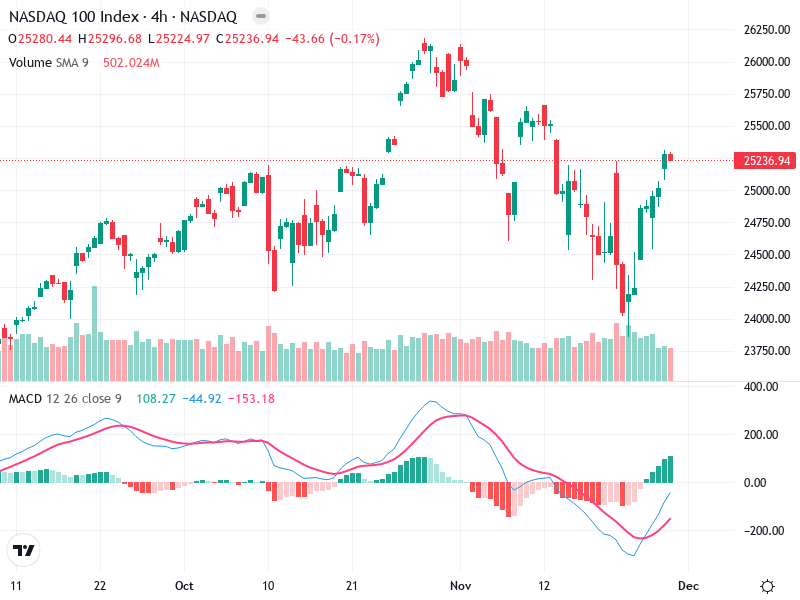
The chart shows a recovery from a recent downtrend, with a current bullish move as price increases.

There are some bullish candlestick patterns, such as a possible bullish engulfing seen in the lower portion of the recent trend, indicating potential reversals.

The price appears to be approaching a resistance zone around the 25,300 level. A breakout above this could indicate further bullish movement.

MACD Analysis

There's a recent bullish crossover, with the MACD line crossing above the Signal line. This suggests strengthening bullish momentum.

The histogram is increasing positively, implying growing bullish momentum.

There is no apparent divergence, as the MACD supports the recent price action.

Volume Analysis

The volume has decreased slightly compared to recent highs but remains consistent amidst the recent bullish action.

The consistent volume supports the current bullish price movement, though a volume increase would be more convincing for a strong breakout.

There aren’t any significant volume spikes indicating unusual activity.

Support & Resistance

The 25,300 level is a notable resistance zone that the price is currently testing.

The recent lows around 24,500 serve as a key support level, marking the base of the recent recovery trend.

No significant changes in other known support or resistance levels.

Actionable Insights

Consider buying on a confirmed breakout above the 25,300 resistance level with increased volume, signaling further upward momentum.

If the price fails to break the 25,300 level and retreats, it may present a short-term selling opportunity or a place to secure profits.

Volume confirmation is crucial for any breakout; watch for increased buying volume to confirm the strength of an upward move.

The AI Technical Analysis Center is an informational tool only and does not constitute investment or trading advice.
This site is registered on wpml.org as a development site. Switch to a production site key to remove this banner.