Generic selectors
Exact matches only
Search in title
Search in content
Post Type Selectors

Popular stocks

Crypto

CFD

Currencies

Support

Gold

NSDQ – Technical Analysis – 4h

December 1, 2025 08:00

Quick Summary

The chart of reveals a developing bullish trend, supported by consistent buying pressure.

There is an evident recovery from a prior downtrend, suggesting renewed investor interest.

The asset is currently approaching a critical resistance level, where a breakout might occur.

Candlestick Analysis

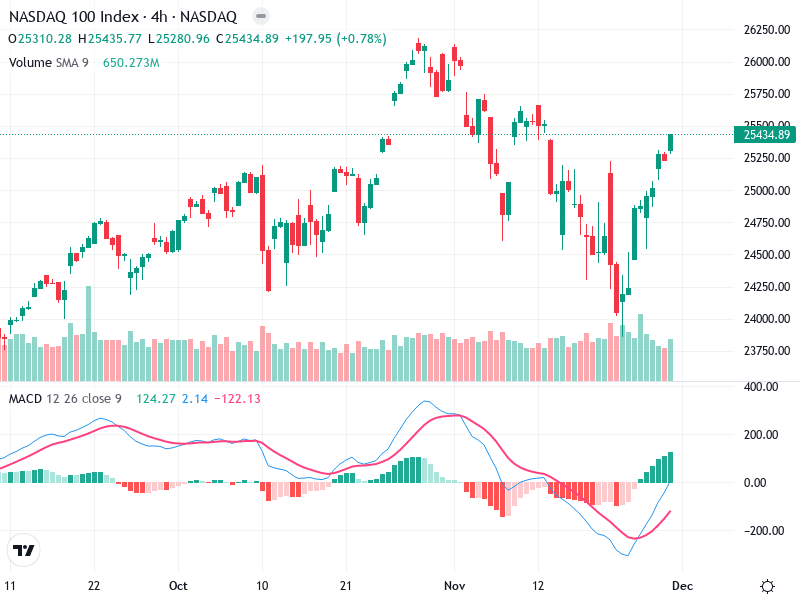
Recently, there is a clear bullish trend with a series of green candlesticks, indicating persistent buying pressure.

Look for patterns like bullish engulfing in this area.

The recent upward move is approaching a potential resistance level around 25,500, suggesting a possible breakout if momentum continues.

MACD Analysis

The MACD line has crossed above the Signal line, indicating a bullish crossover that suggests positive momentum.

The histogram is showing increasing positive bars, reinforcing the current bullish momentum.

There are no significant divergences noted between MACD and price action, which supports the bullish momentum.

Volume Analysis

There is noticeable increased volume during the recent price rise, which supports the bullish price movement.

Look out for spikes in volume during key reversals or breakouts for signs of institutional activity.

The volume behavior aligns with the upward price movement, indicating strong market participation.

Support & Resistance

Key support levels are established around 24,000, a level that has seen previous buying activity.

Key resistance levels are near 25,500, where several peaks have stalled.

These levels present challenges and opportunities for potential breakouts or reversals.

Actionable Insights

Consider buying on a confirmed breakout above the 25,500 resistance with strong volume.

If the price reverses from 25,500 with declining volume, it may indicate a selling opportunity.

Holding is advisable for those already in positions until clear signals for either breaking out or reversal are evident.

The AI Technical Analysis Center is an informational tool only and does not constitute investment or trading advice.
This site is registered on wpml.org as a development site. Switch to a production site key to remove this banner.