Generic selectors
Exact matches only
Search in title
Search in content
Post Type Selectors

Popular stocks

Crypto

CFD

Currencies

Support

Gold

OIL – Technical Analysis – 4h

December 1, 2025 17:00

Quick Summary

The technical chart for indicates a crucial analysis stage. The asset’s performance is currently in a transitional phase, bouncing between key levels.

Investors should focus on the MACD signals and volume patterns to predict future price movements.

Candlestick Analysis

The overall trend appears to be sideways with some fluctuations but no clear long-term direction.

There is a mix of bullish and bearish candles, with some short-term bullish movements. Notably, no strong bullish engulfing or hammer patterns are visible to suggest a strong reversal.

The price recently attempted a pullback but faced resistance near the $60 level.

MACD Analysis

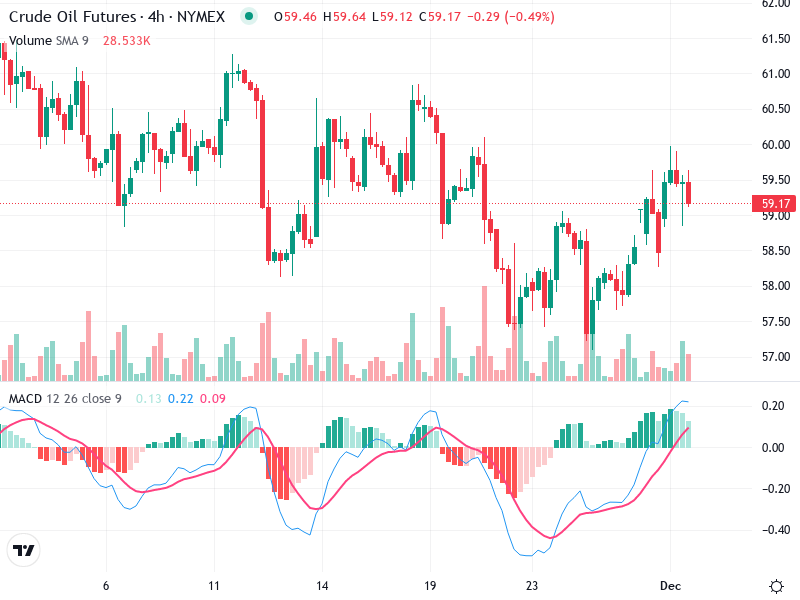
The MACD line is above the Signal line, indicating a recent bullish crossover, which suggests potential upward momentum.

The histogram is showing positive values, reflecting building bullish momentum. However, it indicates some recent weakening as the bars are shortening.

No significant divergence is observed between the MACD and price action.

Volume Analysis

There are noticeable spikes in volume that coincide with price swings, suggesting strong market participation during those times.

The current volume levels are not exceptionally high, which might indicate indecisiveness in the market.

No apparent institutional activity is noted based solely on volume spikes.

Support & Resistance

Key support is around $58, where the price has previously rebounded.

A significant resistance level is around $60, and the price has struggled to break through this level.

Actionable Insights

Given the current sideways trend, a range-bound strategy might be appropriate, buying near the support around $58 and considering selling near resistance at $60.

Watch for a breakout above $60 with strong volume for a potential buy signal.

A break below $58 with increased volume could signal a bearish trend.

The AI Technical Analysis Center is an informational tool only and does not constitute investment or trading advice.
This site is registered on wpml.org as a development site. Switch to a production site key to remove this banner.