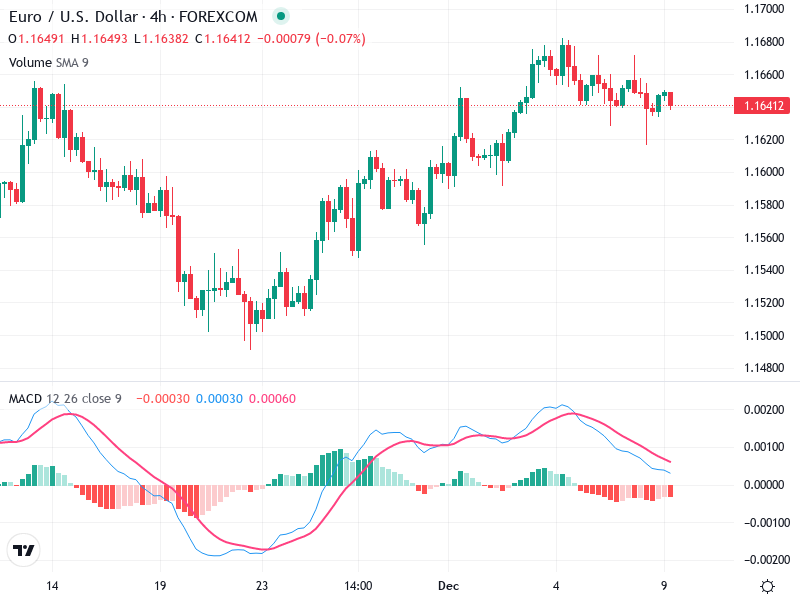
The EUR/USD 4-hour chart is showing signs of consolidation after a recent bullish trend. Key support and resistance levels are in focus for potential breakout opportunities.
The candlestick patterns, MACD indicators, and volume trends are currently suggesting a neutral stance, awaiting further signals.
Candlestick Analysis
The chart shows a recent bullish trend with higher highs and higher lows from late November to early December.
The latest candles indicate some consolidation, with no strong candlestick pattern currently suggesting reversal.
Recent small-bodied candles indicate indecision, often seen during consolidation phases.
MACD Analysis
The MACD line is close to the signal line, indicating a lack of strong momentum.
Both lines are near the zero line, suggesting a neutral stance.
No clear divergence is visible between the MACD and price action, indicating convergence with price.
Volume Analysis
Volume doesn't show significant spikes, indicating a lack of strong conviction from buyers or sellers.
The steady volume supports the idea of consolidation.
Any spike in volume coinciding with a price move could indicate stronger interest and signal a breakout or breakdown.
Support & Resistance
Resistance around 1.1680 – Recent highs, a break above could signal the continuation of the uptrend.
Support around 1.1600 – Previous lows, a break below this level might suggest a shift towards a bearish trend.
The market appears to be in a consolidation phase between these levels.
Actionable Insights
Consider buying on a breakout above 1.1680 with confirmation from increased volume and bullish MACD crossover.
Selling below 1.1600 with volume confirmation and bearish MACD signal could be ideal for bearish traders.
Given the current neutral indicators, holding may be prudent until clearer signals emerge.
The AI Technical Analysis Center is an informational tool only and does not constitute investment or trading advice.