Generic selectors
Exact matches only
Search in title
Search in content
Post Type Selectors

Popular stocks

Crypto

CFD

Currencies

Support

Gold

AUD/USD – Technical Analysis – 4h

December 9, 2025 13:02

Quick Summary

The chart for Asset indicates a cautiously bullish sentiment with significant assessments on key technical indicators.

Traders should focus on the notable resistance level and monitor for volume changes.

Overall, the analysis suggests potential upcoming movements based on technical triggers.

Candlestick Analysis

The chart shows a strong bullish trend that recently appears to have slowed.

A series of small-bodied candles indicates a potential consolidation before the next move.

No major reversal patterns like doji or hammer are evident at first glance.

MACD Analysis

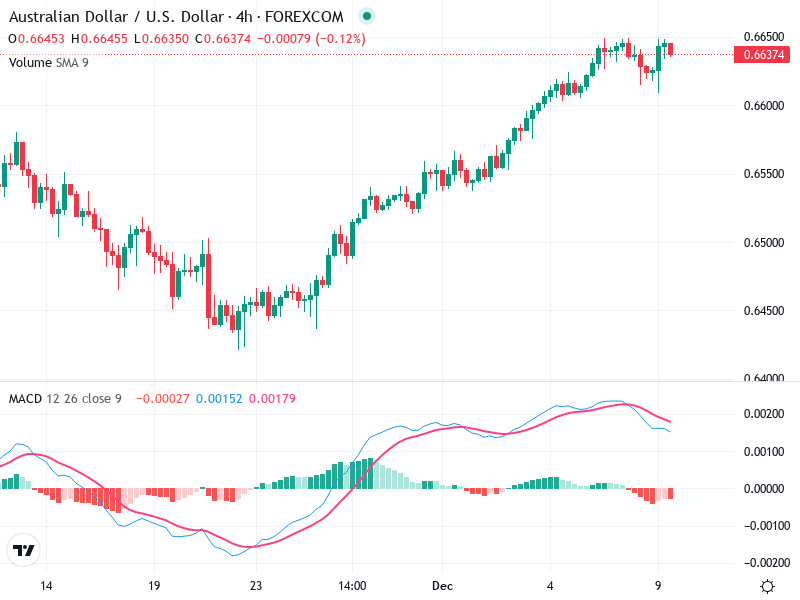
There is a bearish crossover with the MACD line crossing below the Signal line, suggesting a potential weakening of the current bullish momentum.

The histogram has moved into negative territory, indicating a decrease in bullish momentum, which aligns with the crossover.

No clear divergence between MACD and price action, but the slowing momentum is notable.

Volume Analysis

There doesn’t appear to be a significant spike in volume accompanying the recent price moves, suggesting a lack of strong conviction in either direction.

The decreasing volume as price approaches resistance might indicate hesitation among traders.

None observed, implying no significant institutional activity at the moment.

Support & Resistance

Around 0.6655, which has been tested recently.

Likely around 0.6490 to 0.6500, where previous consolidation occurred before the recent rally.

Traders should keep an eye on the 0.6655 resistance level and monitor for volume changes that could signal the next major move.

Actionable Insights

If the price breaks above 0.6655 with increased volume, consider a buy for continuation.

Conversely, a failure to break this level could lead to a potential short opportunity targeting the next support zone.

Watch for confirmation of trend reversal signals if the MACD maintains its bearish crossover.

The AI Technical Analysis Center is an informational tool only and does not constitute investment or trading advice.
This site is registered on wpml.org as a development site. Switch to a production site key to remove this banner.