Generic selectors
Exact matches only
Search in title
Search in content
Post Type Selectors

Popular stocks

Crypto

CFD

Currencies

Support

Gold

NZD/USD – Technical Analysis – 4h

December 10, 2025 13:00

Quick Summary

The chart exhibits several small-bodied candles indicating indecision at the peak of a recent uptrend. This could suggest a potential reversal or consolidation phase. The prevailing bullish trend has led to higher highs and higher lows up to the current point, emphasizing the possibility of continued upward movement if resistance is broken.

Candlestick Analysis

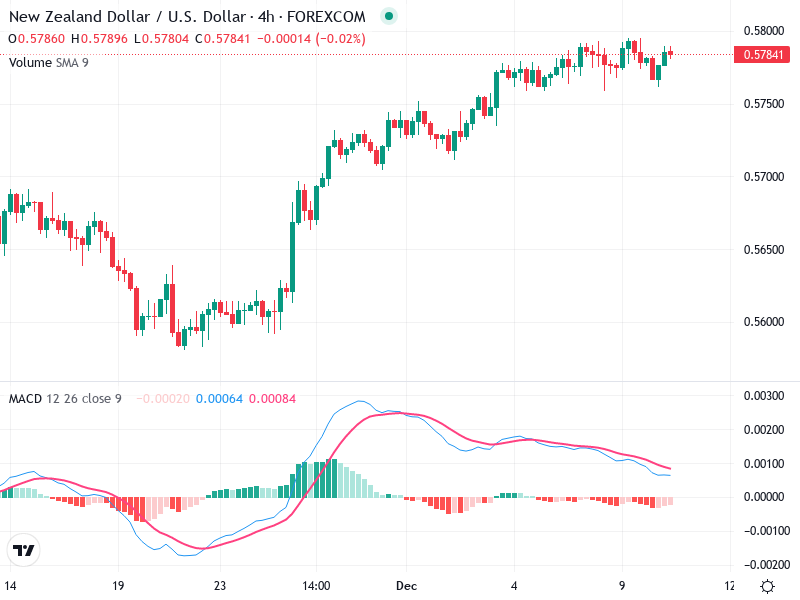
Currently, there are several small-bodied candles suggesting indecision at the top of a recent uptrend, commonly indicative of a potential reversal or consolidation.

The chart shows a strong bullish trend leading up to the current point with a series of higher highs and higher lows.

The area around 0.5780, where the current price resides, acts as a potential short-term resistance level given the recent stall in upward momentum.

MACD Analysis

A bearish crossover is forming with the MACD line crossing below the signal line, suggesting a slowdown in bullish momentum.

The histogram is moving towards the zero line, indicating weakening bullish momentum. If the trend continues, this may signal a change in trend direction.

There's no evident divergence between MACD and price action as both are aligned, but momentum appears to be waning.

Volume Analysis

Volume has generally been lower during recent price consolidation, which can be typical as traders wait for a breakout or trend confirmation.

Decreased volume during the current price leveling suggests that the recent uptrend may lack strong bullish conviction, potentially leading to a reversal.

No significant volume spikes suggestive of institutional activity are evident in the current timeframe.

Support & Resistance

Around 0.5750, which provided previous resistance, may act as support if the price pulls back.

Around 0.5800, where price action has recently stalled, indicates potential short-term resistance and a level to watch for a breakout.

Actionable Insights

Consider waiting for a breakout above 0.5800 with confirming volume before entering long positions.

A bearish crossover and price rejection at resistance levels suggest watching for a potential sell signal if price drops below 0.5750 with confirming volume.

Exercise caution and await a clearer signal, as current consolidation indicates indecision.

The AI Technical Analysis Center is an informational tool only and does not constitute investment or trading advice.
This site is registered on wpml.org as a development site. Switch to a production site key to remove this banner.