Generic selectors
Exact matches only
Search in title
Search in content
Post Type Selectors

Popular stocks

Crypto

CFD

Currencies

Support

Gold

NSDQ – Technical Analysis – 4h

December 15, 2025 08:00

Quick Summary

The chart presents a clear analysis of the current market conditions for . It highlights the prevailing trends and possible future movements. Investors should consider both technical indicators and market sentiment.

Candlestick Analysis

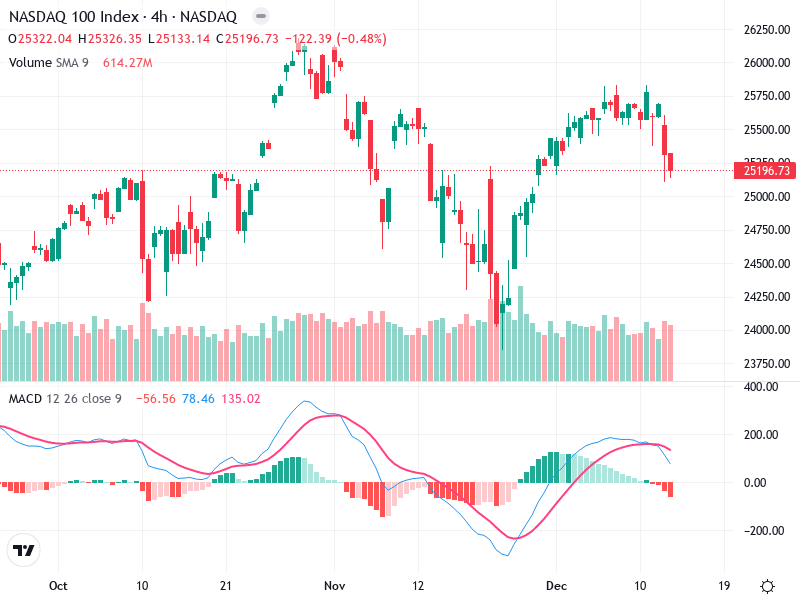
The chart shows a general downtrend with lower highs and lower lows forming, suggesting bearish sentiment.

Recently, there are several red candles with large bodies, indicating strong selling pressure. An engulfing pattern is noted, reinforcing potential continued bearish movement.

A notable zone around 25,750 where price attempted to rise but failed, indicating a resistance level. Pullback down to around 25,200 suggests a potential support level being tested.

MACD Analysis

The MACD line has crossed below the Signal line, indicating a bearish crossover. This suggests increasing bearish momentum.

The histogram is in the negative zone and increasing in magnitude, which supports the bearish trend.

No significant divergences are observed between price action and the MACD, affirming the current downtrend.

Volume Analysis

There is a spike in selling volume coinciding with the recent drop, supporting the downward price movement.

The increase in volume during downward price movement supports bearish sentiment.

A notable increase in volume during the last session suggests possible institutional activity or heightened selling interest.

Support & Resistance

Around 25,200 acts as a crucial support level. If breached, a further decline could be expected.

Approximately at 25,750, where multiple rejections are visible.

Overall vigilance is needed near these levels to gauge market strength.

Actionable Insights

Consider short positions if the price breaks below the 25,200 support with high volume confirmation.

Traders may hold positions if support proves strong and there is a bullish reversal signal.

Watch for confirmation of a bearish breakdown or potential reversal signals such as a bullish engulfing pattern near the support level.

The AI Technical Analysis Center is an informational tool only and does not constitute investment or trading advice.
This site is registered on wpml.org as a development site. Switch to a production site key to remove this banner.